QQQ Blow Out Indicates Closer to bottom I have been waiting for the blow out at the bottom and this has some of those markings but it will take severals days to be sure.
QQQ trade ideas

QQQ - Trade Ideas - Market OverboughtI see so many posting trades using an hour or 30 minute candles, counting waves like it is meaningful. It is not, it is simply amateur at best unless you are day trading. For swing trades I like I always start with the weekly candles. It paints a broader picture, not just some inner day noise that randomly prints patterns.
So I have been watching this market for a couple months now, continue to grind higher and higher and higher, BUT we have some uncertainty coming up, and also we printed a potential short pattern on a weekly time frame.
Like most things in life, other than war and being sick, longer is better!!! ;).
This is a trade I like here and will take myself next week as I like buying over sold markets, and selling over bought. Now yes.... there is the old adage "don't short into a bull market", but that is more of a newb type of thing and not something I pay much attention to. Yes the market can stay overbought longer than shorts can stay liquid, but that is why we have a stop!!!
Bearish pinbar into an extended market and looking for a potential 10% or greater pullback in the near term.
I posted two trade ideas, one is a swing trade for you traders out there that like action. Short and sweet, look for 1-3 weeks to play out.
The other is a Position trade, and the one I will be taking. Notice the stop is moved higher, and the targets are much lower. It also has a greater Reward : Risk to it. Over the years I have given up being Action Jackson and I have had a lot of gains over the past year and I want to hedge them so this is one way to do that.
No I am not selling NVDA though it has become quite a huge position in my portfolio. At least not yet, the market is still bull!!!
So before I get the comment "if you think it is still bull, why are you shorting here?"
1) Over bought conditions (slightly not a hyper excited market)
2) After large runs 10% pullbacks are quite common
3) Election year and the debate is next week - creating a little uncertainty on how it may come out.
4) Biden moving up in the polls, market is hesitating. I read the tea leaves, so I don't care what you think of Biden or Trump. The fact Trump met with business leaders, when 4 years ago they wouldn't give him the time of day. Even silicon valley and the NY bankers are warming up to Trump. So if Biden wins, expect the market to pullback, Trump wins, may get another rally.
5) Bearish Pinbar on the weekly
6) The fact "Elliott Wave Masters" are bullish still on their 30 min chart not realizing this could be a B leg of a corrective sequence, since it has not closed above the 0.618 extension.
7) Because I made a lot of money over the last year and I want to hedge!!!
8) Straight up I've been doing this longer than you, or most of you anyways.
Feel free to comment and if you don't know how to calculate risk, ask someone, don't just short blindly. Yes you can also sell calls or buy puts, I will post that trade over the weekend.

QQQ - Options Idea - Selling OptionsSo I am looking to get short the QQQ over the next week or so and one of the ways I like to get short is selling Calls. Now a couple ground rules to go by.
1) Do not sell calls on individual stocks UNLESS you own the stock and it is a covered call. You can get destroyed quickly.
2) Do not sell puts UNLESS you are able to have the contract assigned to you. (this is not applicable to this trade, more if you want to go long a stock, but I am going over general rules overall)
3) Do not get TOOO BIG you can lose your ass quickly.
Selling options is the slow boat to China trade so don't get greedy. Small wins = Big gains.
In lieu of just shorting the market, or in conjunction, if you have that kind of account, selling Calls is a great way to get a little extra premium for shorting.
Now what is the risk here? Well it is a little more risky than shorting outright simply because there is no pre or post market. But overall selling one contract is equal risk to selling 100 shares, to provide some proportion.
What I am going to do on Monday is a mix, of shorting the stock and selling a couple calls. I want to be clear here, I give the market 30-45 min after the open to see if I want to sell a Call based on how the market reacts. Patience may provide a better entry price, also the spreads are a little wider at the open and I generally like to wait for the market to stabilize after the open.
So I am looking at selling 480 Calls in addition to shorting the stock per my previous trade post.
Be patient, and if you have never shorted or sold calls, nothing wrong with doing a paper trade to get the idea of what you are doing. Obviously I will not be sending out real time signals, but I will post Monday my entry and trades.
Have a blessed Weekend!!!!

QQQ SPY BTC Markets Topped This WeekLooking at this weekly chart, although we didnt close RED, we closed as an inverted hammer on the weekly. The weekly timeframe is important to look at. Because its a high timeframe chart, the candles help you understand where the trend is going much more accurately then low time frames like the hourly chart.
Now an inverted hammer isnt THE reason I believed we topped. But it is the price action that triggered me going short over the weekend.
I have been preparing for a top in the market, specifically the Qs since we got close to ATHs.
Why?
If you take a look at DXY, it looks like its about to go parabolic(ill add a chart later). Unemployment rate looks to have bottomed. BTC, Gold, and NVDA look to have topped as well.
An interesting stat i read, 76% of stocks have been in a bear market this whole rally up.
NVDA has held up the entire tech sector almost by itself, along w the other Top 7.
NVDA and APPL both had a huge spike last week which got quickly sold off. Seems to me like it gave that final upthrust after distribution. Which is normally that final move that takes out most short sellers liquidity before actually making that impulse move down.
A lot of people are saying to buy the dip, but Ive seen this before. This will be the dip that doesnt stop dipping.
VIX is very low but looking to be bottoming. TLT is also looking strong.
I will upload a few more charts so you can better understand my view.
Lastly, the green pattern is simply the price action leading up to the last top in the market. And it looks like it has high potential to play out as such. The RSI is also looking to be playing out a major bearish divergence.
Will update in the coming days weeks and months.
Good luck everyone.

QQQ Thursday Gap Up ReversalShort-term & small sample, but an interesting pattern nonetheless...
If we look back at similar events to Thursday's action, they've all been short-term tops in the market. We're looking at: (1) Gap up open on a Thursday; (2) Bearish reversal closing near the lows of the day; (3) Increased Volume from the prior day(s); (4) Preceded by a good run in the market.
I think it's worth noting, although I'm not sure the market dynamic behind it, that these recent short-term tops have all occurred on a Thursday. So seeing similar-type action this past Thursday is sending up a short-term cautionary signal, especially after such a strong runup over the last few weeks. I want to emphasize 'short-term' though, because the long-term trend is still very much in tact. It may also be worth noting the lack of breadth under the hood as an additional short-term cautionary sign, although there are certain areas and groups that have been participating... it's been very much a stock picker's type of environment.

qqq sell!! STILL OVERBOUGHT!Party like it's 1999! Definitely cannot call a top or bottom but we can spot foolishness and bubbles. QQQ needs a correction even to maintain the uptrend
Targets $470.71, $459.94, $451.23 and possibly $442.52

QQQ about to correctWith NVDA finally losing steam, META looking the same, and TSLA looking weak as well I expect a correction here. This index has outperformed for a while. I look to 450-460$ in the coming weeks. By this occurs a test of the 20 EMA on the weekly will be around 450$. I look for a stochastic RSI that is starting to flatten here. Volume has slowly been falling over the year as well. That hammer hammer candle is bearish. Remember, my last few charts have been weekly timeframes, this will take a while to play out.

QQQ In correction territory As we can see QQQ made a double top on June 20th with that day making a bearish engulfing candle followed by a spinning top, all while the RSI is signaling over bought conditions.
In addition, the average volume since April has been dropping as the price has been rising, creating bearish divergence.
Finally, the price is well above the 1 year POC line ($369), the point where the most shares have traded over the last year.
Given the big run and the overbought conditions it appears that QQQ is ready for a correction. Based on the Elliot Wave forecast and the Fibonacci ratios a pullback to a range between $413-$432 (11-15% drop) is very likely, especially with Summer tending to be the weakest part of the seasonal trend as traders take vacations and people "Sell in May and go away."

QQQ: Market of Sellers
It is essential that we apply multitimeframe technical analysis and there is no better example of why that is the case than the current QQQ chart which, if analyzed properly, clearly points in the downward direction.
❤️ Please, support our work with like & comment! ❤️

QQQ Q2 2024QQQ ETF Q2 2024 view with RSI and 200, 100, 50, 20 VWMA indicators.
SPY
GOOGL
NVDA
AMZN
AAPL
MSFT
TSLA
META

Triple witching on FridayTriple witching, also known as quadruple witching, is a financial market event that occurs on the third Friday of March, June, September, and December each year. In 2024, the dates are: March 15, June 21, September 20, and December 20. The simultaneous expiration of stock-index futures, options on stock-index futures, single-stock options and index options can generate significant volatility and volume. However, the E-Mini S&P 500 (ES1!), E-Mini Nasdaq-100 (NQ1!), Dow Jones Industrial Average (YM1!) and Russell 2000 (RTY1!) futures contract switch was last week.
Here's a 1 week chart of SPY and QQQ. This support and resistance trend channel is based on the trajectory so far since the October 2022 low till last weeks high. *if this trend trajectory continues until the end of the year, then SPY range is 550- 590 and QQQ range is 500 - 550 by 1/1/25. However, the red resistance line is a short area and green support line is a long area along the way. *if the trend changes you will know based upon this trend channel.
Don't forget the Markets are closed on Wednesday for the Juneteenth national holiday.

QQQ journal for price at $484I have had the number 84 a ton back in March and April when I though there may be a dump to 384. However, once we broke my upside levels, I had to reassess wth 84 is and realized quickly it was 484.
So this is just for my journal to see what happens once we hit. It's only $3 away. I have negative energy atm and think we may retrace into Friday, but on monthly time frames still go up.

Elliott Wave Expects Nasdaq 100 (QQQ) to Continue HigherShort Term Elliott Wave in Nasdaq 100 ETF (QQQ) suggests it shows a bullish sequence from 4.20.2024 low favoring more upside. Up from 4.20.2024 low, wave 1 ended at 461.5 and pullback in wave 2 ended at 443.06. The ETF has extended higher in wave 3. Internal subdivision of wave 3 is unfolding as a nesting impulsive structure. Up from wave 2, wave (i) ended at 455.58 and wave (ii) ended at 447.9. Wave (iii) higher ended at 465.55 and pullback in wave (iv) ended at 460.54. Last leg wave (v) ended at 465.74 which completed wave ((i)) in higher degree. Pullback in wave ((ii)) ended at 461.5 and the ETF has extended higher.
Up from wave ((ii)), wave i ended at 465.19 and wave ii dips ended at 462.03. Then it rallied higher in wave iii towards 478.28 and wave iv pullback ended at 473.80. Last leg wave v ended at 478.95 which completed wave (i) in higher degree. The ETF then pullback in wave (ii) towards 474.42. Near term, as far as it stays above 461.51, expect pullback to find support in 3, 7, or 11 swing for further upside.

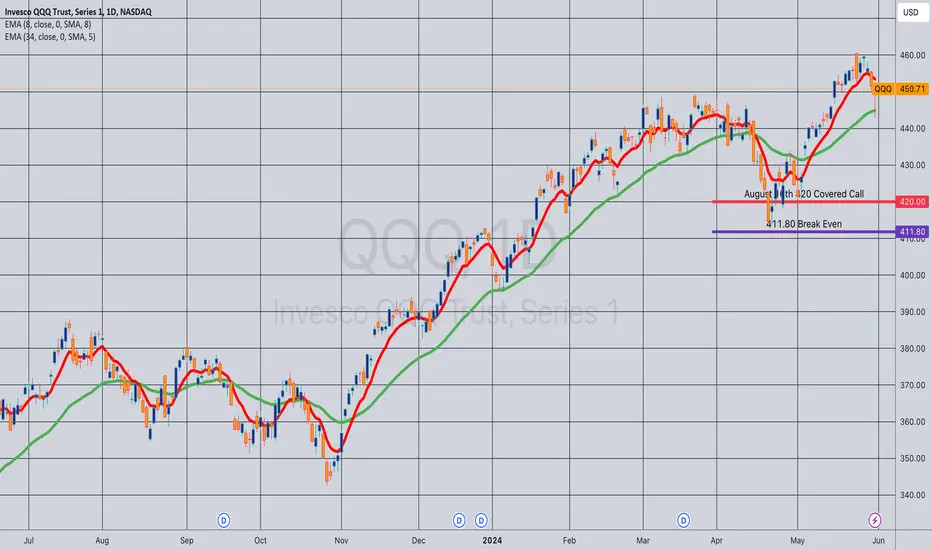
Opened (IRA): QQQ August 16th 420 Monied Covered Call... for a 411.80 debit.
Comments: (Late Post). Sold the -75 call against a one lot to emulate the delta metrics of a 25 delta short put, but with built-in short call defense.
Metrics:
Buying Power Effect/Break Even: 411.80
Max Profit: 8.20 ($820)
ROC at Max: 1.99%
ROC at 50% Max: 1.00%
Will generally look to take profit at 50% max on the entire setup (stock + short call) as a unit, but won't hesitate to roll out the short call if in profit to keep my break even at or near where the underlying is currently trading.
Qqq idea Small channel using the renko charts , small channel inside bigger channel long term channel on red and short on white . I think the markets starts to retrace next week just a temporary pullback . Then maybe after elections the market will decide if it goes to bottom of big channel at 360 or keep rallying to 560. Right now seems to me top tech stocks are a little overbought. I expect the small channel to be tested on support and bounce from there . This is not a financial advidse

QQQ Will Collapse! SELL!
My dear friends,
QQQ looks like it will make a good move, and here are the details:
The market is trading on 479.18 pivot level.
Bias - Bearish
Technical Indicators: Supper Trend generates a clear short signal while Pivot Point HL is currently determining the overall Bearish trend of the market.
Goal - 463.82
About Used Indicators:
Pivot points are a great way to identify areas of support and resistance, but they work best when combined with other kinds of technical analysis
———————————
WISH YOU ALL LUCK

QQQUp move calculated from 259.73
target to 503.48
Circle shape possible come back to angle 315 at 468.71
Finally to executive triangle to go to final point

QQQ: Short Trade with Entry/SL/TP
QQQ
- Classic bearish setup
- Our team expects bearish continuation
SUGGESTED TRADE:
Swing Trade
Short QQQ
Entry Point - 479.18
Stop Loss - 489.67
Take Profit - 457.67
Our Risk - 1%
Start protection of your profits from lower levels
❤️ Please, support our work with like & comment! ❤️

Qs above the lineMeasured move into new ATHs in anticipation of NVDA earnings next week - end of month. Above the midpoint of channel (month). Week view.

Same Same But Different ?We See 4 Years Of Grow With High PE / PS / PB / FWPE With High Interest Rate The Market Look Super Strong Like Cannot Be Beat .. NASDAQ:QQQ

Market Crash - QQQ TopQQQ rejected perfectly on a retest of its previous ascending channel from the rally over the last year. It has finally gone back for that retest after breaking well below in April. It's not a big rejection yet, but this is something bears can feel good about. I'm still confident in my prediction and today has reaffirmed that confidence honestly, but I still question the action on VX. IF QQQ breaks above here and breaks out further, I may get my face ripped off. We shall see.

Will NVDA Stock Split Send QQQ to ATH Today??Outlook - With APPL primed for a run to ATH and NVDA stock split I can
see a rally to the upside if levels hold. Obviously huge news this week so I will stick
to my levels and play whatever side my analysis supports.
Upside Targets:
* 463.41--464.16--465.7
Downside Targets:
* 462.32--461--459.17
Quantum Edge Analytics = T/A supports bullish momentum if 463.41 breaks and holds

Market Crash - QQQ Ascending WedgeHere we have yet another rising wedge, this time on QQQ. This pattern started back in October of 2023, so if we fall below, that's most likely going to be a substantial move. The longer the time period you have for a pattern, the bigger the move. An upside breakout is possible, if it breaks this wedge to the upside that'd be quite bullish. Easy to say it's bullish if it hits a new ATH, but when you have a bearish pattern that flips bullish, it usually adds even more movement. The best odds are for it to fall below.
