QQQ pull back done or another leg down?QQQ had a bad week last week after trying since February to break long term resistance of the Blue trading channel. There was a lot of momentum but ultimately after being squeezed between resistance of the blue channel and support from black channel midline, it was time to take profit for the big guys. Clearly, inflation readings and uncertainty about interest rate cuts were the main factors.
A hard sell off last week to establish a clear down channel with the biggest selling on Friday. Using the channel from August to November last year and with some minor tweaks, you can see that it ended Friday right on the support line.
Another thing I was looking at were several of the most recent pullbacks over the last few years. You can see them overlayed on the peak of March 21st. Going by them, QQQ has already come close to extent of the smaller pullbacks.
In my limited experience, these two indicators are usually a good sign for a rebound this week. The RSI is also in the oversold range and in line with other bottoms. The rebound could just be a short-term rally in the down channel like back in Aug and Sept last year with another leg down in the coming month or so. Or we could see a new attempt to break out of the blue channel.
Either way, I was brave enough to open a few positions Friday before the close. Hopefully I don't regret that.
QQQ trade ideas

QQQ coming into huge resistance🍿Price target near 424NASDAQ:QQQ coming into huge resistance🍿
Price target near 424
Would you be shorting into resistance?
Will it get reject at resistance or breakout?

QQQ Scalping Zones Paying Off on a Friday!! 5/3NASDAQ:QQQ :
Put Support, 420
HVL & HVL 0DTE, 426,
Call Resistance, 438

Opening (IRA): QQQ September 20th 430 Short Put... for a 4.34 credit.
Comments: Adding a rung out in Sept at the <16 delta strike paying around 1% of the strike price in credit to emulate dollar cost averaging Into the Q's. I already have rungs on in June, July, and August ... .
Will naturally back-track into shorter duration if I can get in at strikes better than what I currently have on.

Opening (IRA): QQQ August 16th 370 Short Put... for a 4.30 credit.
Comments: Targeting the <16 delta strike paying around 1% of the strike price in credit to emulate dollar cost averaging into the Q's.
Adding at a strike better than what I currently have on in August ... .

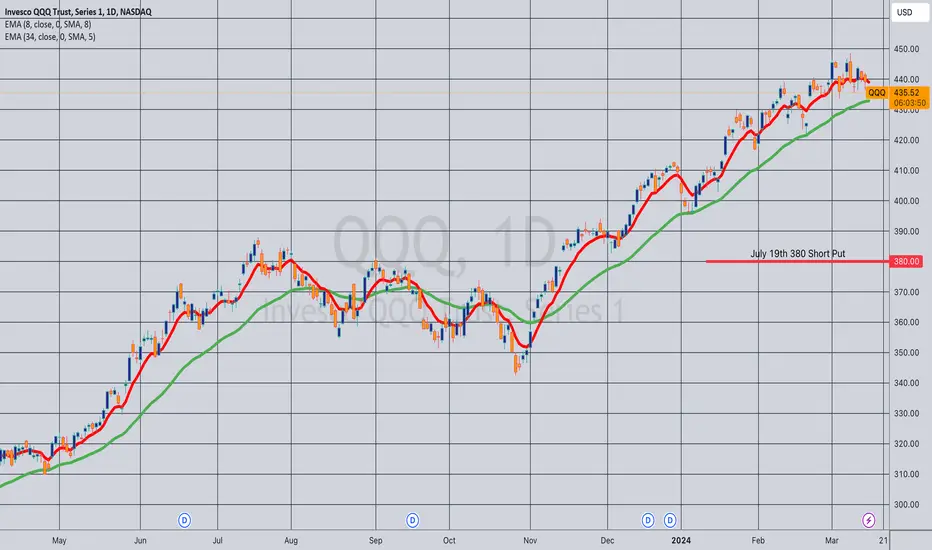
Opening (IRA): QQQ July 21st 380 Short Put... for a 3.90 credit.
Comments: Starting to tip-toe into Q3 (July/August/September) contracts in broad market (IWM, SPY, QQQ). Targeting the <16 delta strike paying around 1% of the strike price in credit to emulate dollar cost averaging into the broad market.
As usual, will look to sell in shorter duration on weakness, assuming I can get in at strikes better than what I currently have on.
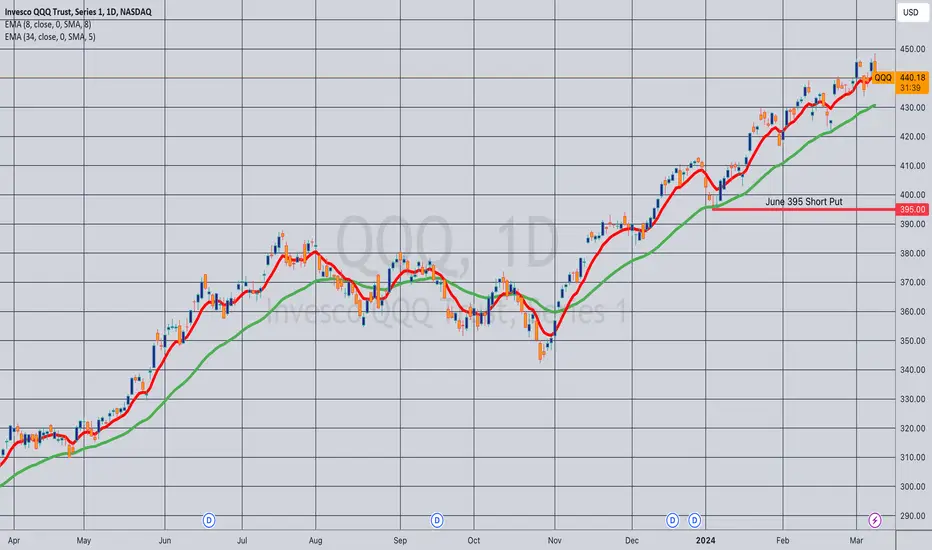
Opening (IRA): QQQ June 21st 395 Short Put... for a 4.09 credit.
Comments: Finally, a bit of weakness ... . Targeting the shortest duration <16 delta strike paying around 1% of the strike price in credit to emulate dollar cost averaging in without actually being in stock.
QQQ Scalping Zones 5/2Upside Targets:
* 426.43427.14/429.60
Downside Targets:
* 424.5/423.6/422.75
Daily Trend Tracker -
*QQQ- *DXY+ *VIX+ *US10Y-

✏️ Weekly Report: Volatility makes Cash the King againGENERAL COMMENTS
Today, the Federal Reserve maintained its interest rates unchanged, highlighting the ongoing challenges in curbing inflation. Initially, this announcement propelled the markets upwards, but a sharp downturn occurred in the final hour, leading to a decline as the day concluded.
The erratic market behavior demonstrated today makes it increasingly challenging to maintain positions in momentum stocks, and the majority of this quarter's earnings reports have been underwhelming. This situation underscores the strategy that cash remains paramount, complemented by selective, quick trading opportunities, as depicted in the following charts.
I will begin tonight's chart analysis with the Nasdaq-100 (QQQ).
NASDAQ:QQQ
The Qs are forming a bearish formation. What is worrying is that this is below the 50D Simple Moving average. As trading is a probabilities game, we can conclude that this leads to probabilities being lower that we continue to the downside. However, the direction of the general market indexes are very well influenced by the fundmental story of the economy health.
––––––––––––––––––––––––––––––––––––––––––––––––––––
NASDAQ:SMTC
SMTC is up $4 from the $33 Buy Point (alerted in previous versions of this idea - go and check. Believe and Follow). This peaked yesterday with about +20% profit since the alert last week. Of course the way I manage this is never to let this to turn into a loss. My general go to tool is to take half here.
––––––––––––––––––––––––––––––––––––––––––––––––––––
NASDAQ:KLAC
KLAC fell back to $687 after missing earnings. This of course stopped me out - but at no loss, since I move stopped up to break-even.
––––––––––––––––––––––––––––––––––––––––––––––––––––
NASDAQ:SMCI
The stock missed its earnings and suffered a severe reaction of a gap down and drop -20% on the intraday.
––––––––––––––––––––––––––––––––––––––––––––––––––––
NASDAQ:NVDA
NVDA slashed below the 50D SMA and this stopped me out. Waiting and watching this TML during its base building period.
––––––––––––––––––––––––––––––––––––––––––––––––––––
NYSE:GS
Up $7 from the $419 buy point with stop raised to $416 just in case.
––––––––––––––––––––––––––––––––––––––––––––––––––––
NYSE:CRM
CRM is prone to go lower if the market continues falling. A break below $266.50 is great place to short.
––––––––––––––––––––––––––––––––––––––––––––––––––––
NYSE:LLY
Gapped up on good earnings. The next technical buy point is $801 accommodated with heavy volume.
––––––––––––––––––––––––––––––––––––––––––––––––––––
NASDAQ:MRNA
Earnings are due out tomorrow. If earnings are good then zooming through the $116 on good volume is a great technical buy point

$QQQ Bear Flag to the 200DMANASDAQ:QQQ Bear Flag to the 200DMA
Do in last night’s video I went over this in much more detail, but before I take the bear flag off of my chart I want to publish it to see how it plays out. And the bear flag also looks like the handle to an inverted cup and handle. 200DMA is a very real target.

NASDAQ breaking below YTD supportUS stocks, led by mega cap tech companies and the NASDAQ writ large, started 2024 on a hot streak. But as momentum slowed, an arc pattern supporting the market became clear, only to be decisively broken. Analysis of key support and resistance levels provides price targets for the coming weeks.

QQQ Scalping Zones 5/1 - Stay Safe with my levels!!Upside Targets:
* 423.62/424.53/426.41
Downside Targets:
* 421.96/420.72/418.54
Daily Trend Tracker -
*QQQ-Bearish *DXY-Bullish *VIX-Bullish - *US10Y-Bullish

Main Stock Review 4-30-24going over our main stocks looking for clues as to what the market wants to do. going to do a review based off the hourly chart for our main focus group daily now after lunch.

Main Stock Review End of day upday 4-29-24Going over our Main Focus list for the Day. not going to let any easy trades pass our watch. reflecting to see how we could have traded better today.

Main Focus List REview - Stocks 4-29-24 Morn/OVN sessionsgoing over our main focus list stocks Morning & Overnight session looking for clues and talking which are the strongest & weakest and which we should be focused on.

QQQ GOING FORWARD abc x abc CHOP till mid early may The chart posted is what I see forming within the correction phase . as you can see the Dia and Iwm are showing some real sights of weakest the game of musical chairs one by one drop off So far best of trades Wavetimer

QQQ Sellers In Panic! BUY!
My dear followers,
This is my opinion on the QQQ next move:
The asset is approaching an important pivot point 414.64
Bias - Bullish
Technical Indicators: Supper Trend generates a clear long signal while Pivot Point HL is currently determining the overall Bullish trend of the market.
Goal - 423.93
About Used Indicators:
For more efficient signals, super-trend is used in combination with other indicators like Pivot Points.
———————————
WISH YOU ALL LUCK

QQQ Scalping Zones 4/29Upside Targets:
* 432.61/433.11/436.01
Downside Targets:
* 432.11/430.81/429.58
Daily Trend Tracker -
*QQQ - Bullish *DXY - Bullish - *VIX - Bearish - *US10Y - Bearish

✏️ Weekly Report: "Buy in May and Stay"?MARKET OVERVIEW
The stocks had a good turnaround after a strong report from $NASDAQ:KLAC. NASDAQ:MSFT Also posted strong earnings!
Could the famous saying "Sell in May and go away" turn to "Buy in May and Stay"?
Lets review some charts.
NASDAQ:QQQ
The Qs snapped back after strong earnings. Now it looks like we are heading for the 50D SMA
––––––––––––––––––––––––––––––––––––––––––––––––––––
NASDAQ:KLAC
Up $19 from the $687 buy point that I shared in previous idea ( see related ideas below )
––––––––––––––––––––––––––––––––––––––––––––––––––––
NASDAQ:NVDA
Mentioned it in previous idea ( see related ideas below ) before it skyrocketed $51. Could consider here or a little bit lower if it consolidates.
––––––––––––––––––––––––––––––––––––––––––––––––––––
NASDAQ:SMTC
Up $2 from the $33 buy point mentioned last week on the idea. Potential add point is the $35ish level.
––––––––––––––––––––––––––––––––––––––––––––––––––––
NASDAQ:META
We warned about META, what we are seeing is that buyers are stepping in on Friday and Thursday to support it. For the aggressive traders could play a snap back but personally, I would pass.
––––––––––––––––––––––––––––––––––––––––––––––––––––
NASDAQ:MSFT
MSFT snapped and squatted lower. Consolidation around the 50D SMA would present a good opportunity for a buy. Before that I would pass.
––––––––––––––––––––––––––––––––––––––––––––––––––––
BINANCE:BTCUSDT
Nothing to do on Bitcoin but wait during the base building period is over

QQQ longer term UpdateGoing over the QQQ longer term chart looking for clues to what the market is telling us.

QQQ Bears Ideal ScenarioHere is what I am looking for next week. The monthly profile for this month still has some poor structure below to repair, and I believe the $434–436 area for NASDAQ:QQQ and SEED_ALEXDRAYM_SHORTINTEREST2:NQ will be crucial for bears to hold for a higher low.

QQQ Scalping Zones 4/26Scalping zones worked pretty will this morning.
Upside Targets:
*
Downside Targets:
*
Daily Trend Tracker
*DXY - Bullish - *VIX - Bearish - *US10Y - Bullish

Where will QQQ go from here?Slight correction is expected but long term trend line remains with target price of USD520 by 2025
