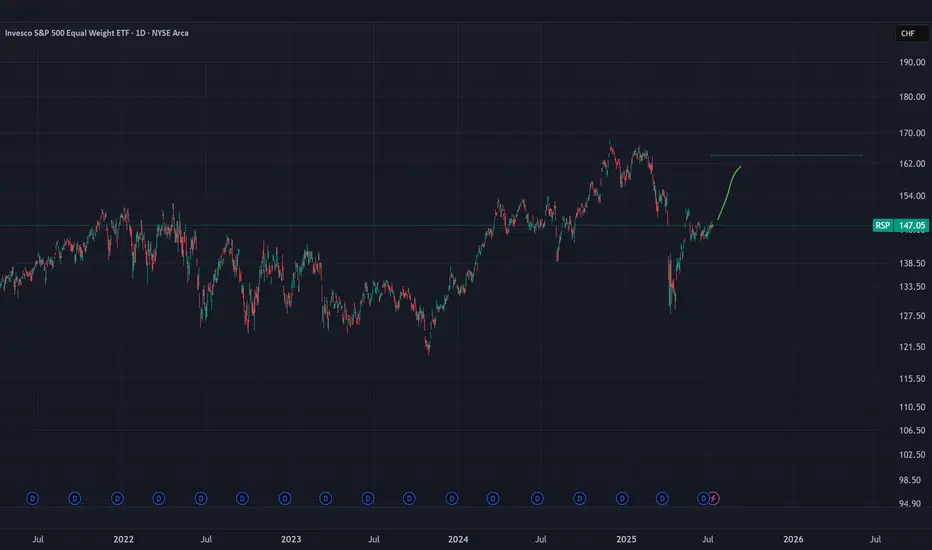
SP500 but equal weighted and in a strong CHF currencythis is the much much better index to follow as it isnt swayed by 10% moves in tesla or NVIDIA and also isnt tricked by USD dollar devaluation ;)
this is the real international index to follow
Key stats
About INVESCO EXCHANGE TRADED FD TR
Home page
Inception date
Apr 24, 2003
Structure
Open-Ended Fund
Replication method
Physical
Dividend treatment
Distributes
Distribution tax treatment
Qualified dividends
Income tax type
Capital Gains
Max ST capital gains rate
39.60%
Max LT capital gains rate
20.00%
Primary advisor
Invesco Capital Management LLC
Distributor
Invesco Distributors, Inc.
Probably one of the best-known equal-weighted ETFs, RSP simply takes all the stocks in the S&P 500 and weights them equally. Equal weighting greatly increases the footprint of smaller S&P 500 stocks (many of which we consider to be midcaps), which results in higher beta for the portfolio. However, equal weighting also lowers concentration, reducing blow-up risk from any one name. While one should expect some sector biases here as well, RSP does not equal-weight sectors as some peer equal-weight ETFs do. Quarterly rebalancing implements the contrarian theme baked into all equal-weight plays: sell winners and buy losers.
Related funds
Classification
What's in the fund
Exposure type
Finance
Technology Services
Electronic Technology
Stock breakdown by region
Top 10 holdings
Longterm S&P 500 Equal weight.The long-term Elliott Wave pattern appears to be approaching completion, and primary Wave 5 could be an ending diagonal.
This formation suggests a significant reversal down to the start of the E.D, which would be around the COVID low. This would be only be Wave A in a larger bearish pattern.

I'm betting on the rise of the S\&P 500, therefore I'm betting oWe broke through the local level and are confidently moving toward the all-time high.
We are also above all moving averages, which gives us additional confidence in our trade.

RSP Spiral cycle peak 5/16 EXIT The chart posted is the RSP SP 500 EQUAL WEIGHTED the two high based on spirals are due to peak on Friday late . We should have a short term top and the begin a pullback for wave 4 . Best of trades WAVETIMER

Market OutlookMarkets looking a little over extended and would be normal to see a pull back soon before resuming to the upside.

Selling America - Buying EUThis is a long term trend analyzing the US market from the perspective of foreign investors. Not valuing the S&P500 500 in USD. Instead, valuing the S&P500 in multiplies of the European Stoxx 600. A multi-year trend of the US outperforming the EU has been broken.

#RSP and a simple parallel channel give a hope for the next weekHi there!
What a ride! I believe it’s a good thing that the market is closed for the weekend—I need to recharge my battery.
Today's thoughts:
If we draw a parallel channel on #RSP, which is equally structured by weight, we can observe that the price has touched the lower line.
This means that, t

RSP and WHY I AM BULLISH STILL197/199 target The chart posted is the sp 500 equal weighted RSP has dropped to a trend line dated back to march 23 2020 . I have three clean points and all are major . Elliot Wave calls for a final 5th wave to end this advance in the area of 198 plus or minus 1.25 Fib relationship and PUT /CALL as well as

Time for equal weight?Seems to be that the equal weight S&P is going to breakout against the S&P. An outperformance of rsp is essentially a value vs growth trade. We will see in the coming weeks how this plays out

Market Going UPWe have been doing a cup and handle pattern for a long time...
The RSP shows you what the general market is doing unweighted and less distorted.
We have been experiencing much downfalls in the previous weeks in the BIG STOCKS,
but the rest of the market was not impacted...
This means...
Someone

See all ideas
Summarizing what the indicators are suggesting.
Oscillators
Neutral
SellBuy
Strong sellStrong buy
Strong sellSellNeutralBuyStrong buy
Oscillators
Neutral
SellBuy
Strong sellStrong buy
Strong sellSellNeutralBuyStrong buy
Summary
Neutral
SellBuy
Strong sellStrong buy
Strong sellSellNeutralBuyStrong buy
Summary
Neutral
SellBuy
Strong sellStrong buy
Strong sellSellNeutralBuyStrong buy
Summary
Neutral
SellBuy
Strong sellStrong buy
Strong sellSellNeutralBuyStrong buy
Moving Averages
Neutral
SellBuy
Strong sellStrong buy
Strong sellSellNeutralBuyStrong buy
Moving Averages
Neutral
SellBuy
Strong sellStrong buy
Strong sellSellNeutralBuyStrong buy
Displays a symbol's price movements over previous years to identify recurring trends.
Frequently Asked Questions
An exchange-traded fund (ETF) is a collection of assets (stocks, bonds, commodities, etc.) that track an underlying index and can be bought on an exchange like individual stocks.
RSP trades at 182.20 USD today, its price has fallen −0.75% in the past 24 hours. Track more dynamics on RSP price chart.
RSP net asset value is 182.77 today — it's risen 2.08% over the past month. NAV represents the total value of the fund's assets less liabilities and serves as a gauge of the fund's performance.
RSP assets under management is 74.19 B USD. AUM is an important metric as it reflects the fund's size and can serve as a gauge of how successful the fund is in attracting investors, which, in its turn, can influence decision-making.
RSP price has risen by 2.71% over the last month, and its yearly performance shows a 8.58% increase. See more dynamics on RSP price chart.
NAV returns, another gauge of an ETF dynamics, have risen by 2.08% over the last month, showed a 11.69% increase in three-month performance and has increased by 9.83% in a year.
NAV returns, another gauge of an ETF dynamics, have risen by 2.08% over the last month, showed a 11.69% increase in three-month performance and has increased by 9.83% in a year.
RSP fund flows account for 39.12 B USD (1 year). Many traders use this metric to get insight into investors' sentiment and evaluate whether it's time to buy or sell the fund.
Since ETFs work like an individual stock, they can be bought and sold on exchanges (e.g. NASDAQ, NYSE, EURONEXT). As it happens with stocks, you need to select a brokerage to access trading. Explore our list of available brokers to find the one to help execute your strategies. Don't forget to do your research before getting to trading. Explore ETFs metrics in our ETF screener to find a reliable opportunity.
RSP invests in stocks. See more details in our Analysis section.
RSP expense ratio is 0.20%. It's an important metric for helping traders understand the fund's operating costs relative to assets and how expensive it would be to hold the fund.
No, RSP isn't leveraged, meaning it doesn't use borrowings or financial derivatives to magnify the performance of the underlying assets or index it follows.
In some ways, ETFs are safe investments, but in a broader sense, they're not safer than any other asset, so it's crucial to analyze a fund before investing. But if your research gives a vague answer, you can always refer to technical analysis.
Today, RSP technical analysis shows the buy rating and its 1-week rating is buy. Since market conditions are prone to changes, it's worth looking a bit further into the future — according to the 1-month rating RSP shows the strong buy signal. See more of RSP technicals for a more comprehensive analysis.
Today, RSP technical analysis shows the buy rating and its 1-week rating is buy. Since market conditions are prone to changes, it's worth looking a bit further into the future — according to the 1-month rating RSP shows the strong buy signal. See more of RSP technicals for a more comprehensive analysis.
Yes, RSP pays dividends to its holders with the dividend yield of 1.57%.
RSP trades at a premium (0.08%).
Premium/discount to NAV expresses the difference between the ETF’s price and its NAV value. A positive percentage indicates a premium, meaning the ETF trades at a higher price than the calculated NAV. Conversely, a negative percentage indicates a discount, suggesting the ETF trades at a lower price than NAV.
Premium/discount to NAV expresses the difference between the ETF’s price and its NAV value. A positive percentage indicates a premium, meaning the ETF trades at a higher price than the calculated NAV. Conversely, a negative percentage indicates a discount, suggesting the ETF trades at a lower price than NAV.
RSP shares are issued by Invesco Ltd.
RSP follows the S&P 500 Equal Weighted. ETFs usually track some benchmark seeking to replicate its performance and guide asset selection and objectives.
The fund started trading on Apr 24, 2003.
The fund's management style is passive, meaning it's aiming to replicate the performance of the underlying index by holding assets in the same proportions as the index. The goal is to match the index's returns.