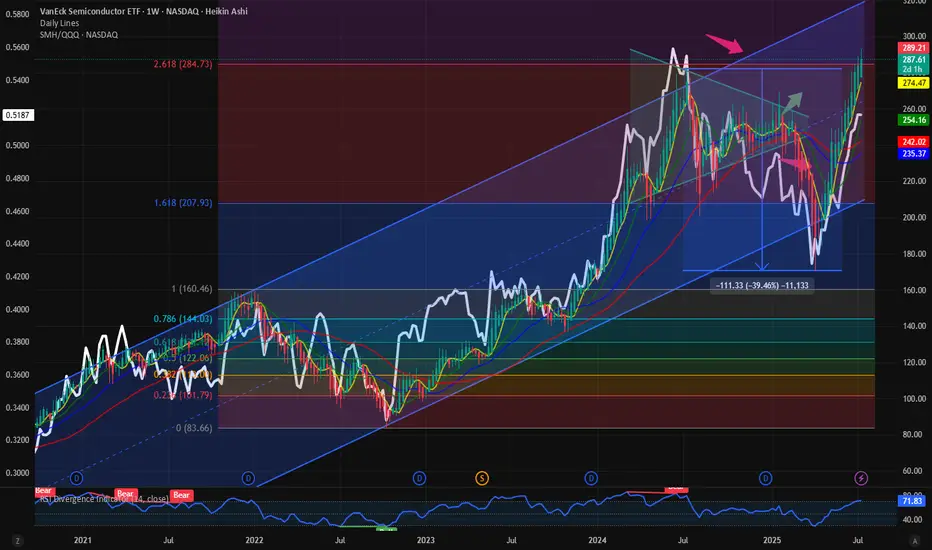
Bearish DivergencesWe could be running out of steam here. This to me looks like the final leg of the grand supercycle in semis. Bearish divergences on the RSI and a final 5th wave move up. If we reach $300 I’d expect a rejection and possible roll over. Keep an eye on this, retail are loading up but the charts don’t su
Key stats
About VANECK ETF TR
Home page
Inception date
May 5, 2000
Structure
Open-Ended Fund
Replication method
Physical
Dividend treatment
Distributes
Distribution tax treatment
Qualified dividends
Income tax type
Capital Gains
Max ST capital gains rate
39.60%
Max LT capital gains rate
20.00%
Primary advisor
Van Eck Associates Corp.
Distributor
Van Eck Securities Corp.
SMH is a highly concentrated fund that invests in common stocks and depositary receipts of US-listed semiconductor companies, similar to our benchmark. Midcap companies and foreign companies listed in the US can also be included. To be initially eligible, 50% of company revenues must be primarily in the production of semiconductors and semiconductor equipment. The top 50 eligible companies by market cap are then given two separate ranks based on free-float market capitalization in descending order and three-month average-daily-trading volume in descending order. Those two ranks are summed and the highest ranked 25 companies are selected. A capping scheme is applied to ensure diversification and more weight is given to the larger companies.
Related funds
Classification
What's in the fund
Exposure type
Electronic Technology
Stock breakdown by region
Top 10 holdings

Semis ready to rip to price discoveryAMEX:SOXL NASDAQ:SMH
Semiconductors just waiting for the tarrif announcements to pass to blast off to all time highs

Opening (IRA): SMH August 15th 215 Short Put... for a 2.50 credit.
Comments: A starter position in the semiconductor ETF on a smidge of weakness here, targeting the strike paying around 1% of the strike price in credit.
Will generally look to add at intervals if I can get it at a strike better than what I currently have on.

$SMH / $QQQ: Ratio below ATH; Still more room for upside It’s the semis which are the hallmark of a cyclical bull market. It is always the Semis which indicate the start of a bull market and the first to fold over towards the end of a cyclical bull market. Hence the outperformance of Semis as a momentum sector is important from a symbolism perspective and
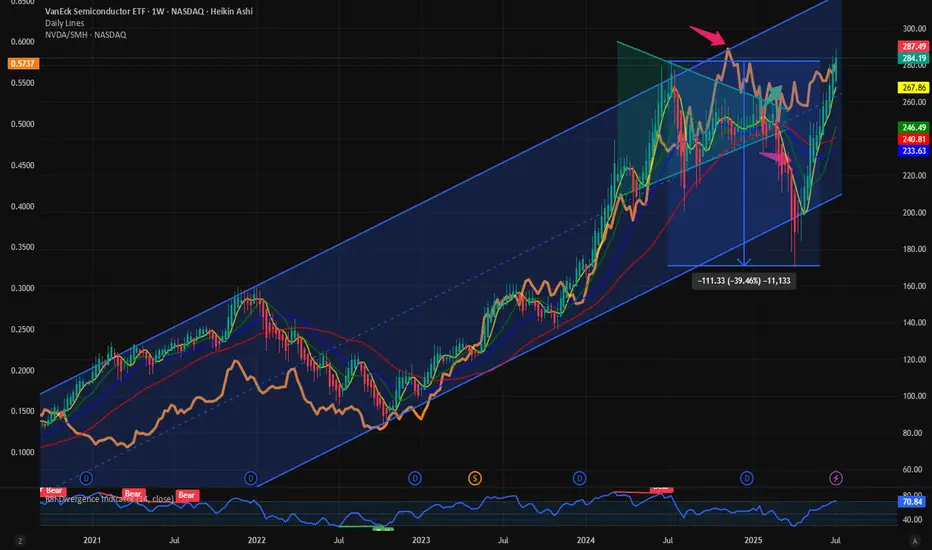
$SMH and $NVDA Dominance: Some more room to run for bothWith NASDAQ:NVDA and NASDAQ:SMH above their respective ATH the focus returns to the fact how far we can expect for both to outperform and make new highs. In this Blog we floated the idea of NASDAQ:NVDA dominance. This indicates the % of return / price movement in NASDAQ:SMH contributed by
Semiconductors into MAJOR resistanceAs you can see from this weekly chart, the semiconductors have tried three different times to get above this trend line and have gotten rejected all three times. Could it go higher from here? Of course it could, but you have to ask yourself what are the probabilities that it will continue to go up t

SMH BREAKOUT: Semiconductor ETF Explodes Higher After 13-Month VanEck Semiconductor ETF (SMH) - 1Y Chart Analysis
THE SETUP:
After 13 months of sideways chop between $180-$240, SMH has finally broken out with real conviction. This lengthy accumulation phase built a massive foundation for what could be the next major leg higher.
KEY LEVELS:
Breakout Level: $24

Opening (IRA): SMH July 18th 195 Short Put... for a 2.23 credit.
Comments: Adding at a strike better than what I currently have on at the 205 ... .

SMH Long Swing Setup – Buy the Dip or Overbought Trap? (2025-06-📈 SMH Long Swing Setup – Buy the Dip or Overbought Trap? (2025-06-12)
Ticker: NASDAQ:SMH | Strategy: 🟢 Equity Long Swing
Bias: Bullish with caution | Confidence: 70%
Hold Period: 3–4 weeks | Entry Timing: Market Open
🔍 Technical & Sentiment Snapshot
• Trend (Daily/Weekly): Strongly Bullish
• Shor

SMH/SPY | Bullish Breakout | Tech Rotation | (June 8, 2025)SMH/SPY | Bullish Breakout | Tech Rotation Signal | (June 8, 2025)
1️⃣ Insight Summary:
The SMH (Semiconductor ETF) vs. SPY (S&P 500 ETF) ratio is breaking out of a key parallel channel, signaling strong capital rotation into semiconductors. This often precedes broader tech strength — and it’s happ

See all ideas
Summarizing what the indicators are suggesting.
Oscillators
Neutral
SellBuy
Strong sellStrong buy
Strong sellSellNeutralBuyStrong buy
Oscillators
Neutral
SellBuy
Strong sellStrong buy
Strong sellSellNeutralBuyStrong buy
Summary
Neutral
SellBuy
Strong sellStrong buy
Strong sellSellNeutralBuyStrong buy
Summary
Neutral
SellBuy
Strong sellStrong buy
Strong sellSellNeutralBuyStrong buy
Summary
Neutral
SellBuy
Strong sellStrong buy
Strong sellSellNeutralBuyStrong buy
Moving Averages
Neutral
SellBuy
Strong sellStrong buy
Strong sellSellNeutralBuyStrong buy
Moving Averages
Neutral
SellBuy
Strong sellStrong buy
Strong sellSellNeutralBuyStrong buy
Displays a symbol's price movements over previous years to identify recurring trends.
Frequently Asked Questions
An exchange-traded fund (ETF) is a collection of assets (stocks, bonds, commodities, etc.) that track an underlying index and can be bought on an exchange like individual stocks.
SMH trades at 290.00 USD today, its price has risen 1.58% in the past 24 hours. Track more dynamics on SMH price chart.
SMH net asset value is 289.43 today — it's risen 10.36% over the past month. NAV represents the total value of the fund's assets less liabilities and serves as a gauge of the fund's performance.
SMH assets under management is 27.30 B USD. AUM is an important metric as it reflects the fund's size and can serve as a gauge of how successful the fund is in attracting investors, which, in its turn, can influence decision-making.
SMH price has risen by 11.54% over the last month, and its yearly performance shows a 4.09% increase. See more dynamics on SMH price chart.
NAV returns, another gauge of an ETF dynamics, have risen by 10.36% over the last month, showed a 43.29% increase in three-month performance and has increased by 6.46% in a year.
NAV returns, another gauge of an ETF dynamics, have risen by 10.36% over the last month, showed a 43.29% increase in three-month performance and has increased by 6.46% in a year.
SMH fund flows account for 7.24 B USD (1 year). Many traders use this metric to get insight into investors' sentiment and evaluate whether it's time to buy or sell the fund.
Since ETFs work like an individual stock, they can be bought and sold on exchanges (e.g. NASDAQ, NYSE, EURONEXT). As it happens with stocks, you need to select a brokerage to access trading. Explore our list of available brokers to find the one to help execute your strategies. Don't forget to do your research before getting to trading. Explore ETFs metrics in our ETF screener to find a reliable opportunity.
SMH invests in stocks. See more details in our Analysis section.
SMH expense ratio is 0.35%. It's an important metric for helping traders understand the fund's operating costs relative to assets and how expensive it would be to hold the fund.
No, SMH isn't leveraged, meaning it doesn't use borrowings or financial derivatives to magnify the performance of the underlying assets or index it follows.
In some ways, ETFs are safe investments, but in a broader sense, they're not safer than any other asset, so it's crucial to analyze a fund before investing. But if your research gives a vague answer, you can always refer to technical analysis.
Today, SMH technical analysis shows the buy rating and its 1-week rating is buy. Since market conditions are prone to changes, it's worth looking a bit further into the future — according to the 1-month rating SMH shows the buy signal. See more of SMH technicals for a more comprehensive analysis.
Today, SMH technical analysis shows the buy rating and its 1-week rating is buy. Since market conditions are prone to changes, it's worth looking a bit further into the future — according to the 1-month rating SMH shows the buy signal. See more of SMH technicals for a more comprehensive analysis.
Yes, SMH pays dividends to its holders with the dividend yield of 0.38%.
SMH trades at a premium (0.31%).
Premium/discount to NAV expresses the difference between the ETF’s price and its NAV value. A positive percentage indicates a premium, meaning the ETF trades at a higher price than the calculated NAV. Conversely, a negative percentage indicates a discount, suggesting the ETF trades at a lower price than NAV.
Premium/discount to NAV expresses the difference between the ETF’s price and its NAV value. A positive percentage indicates a premium, meaning the ETF trades at a higher price than the calculated NAV. Conversely, a negative percentage indicates a discount, suggesting the ETF trades at a lower price than NAV.
SMH shares are issued by Van Eck Associates Corp.
SMH follows the MVIS US Listed Semiconductor 25. ETFs usually track some benchmark seeking to replicate its performance and guide asset selection and objectives.
The fund started trading on May 5, 2000.
The fund's management style is passive, meaning it's aiming to replicate the performance of the underlying index by holding assets in the same proportions as the index. The goal is to match the index's returns.