SMH staying shrt 244daily wants snap back
weekly says we go lower in time
look selling to the buying
SMH trade ideas

Staying short SMH 243.98 up 7%Daily stoch on bottom we can get a rally
back to 240 the 50 day ma. took 3/4 off still have some left on
weekly says stay short just a snap back into a down trend
see lower highs look selling vol

SMH 75% PoP & 18% profit in 2 weeks with monthly verticalQuick 2 week vertical play:
* Bullish triangle
* Buy volume
* 14 month bullish trend
Max profit: $156
Probability of Profit: 75%
Profit Target relative to my Buying Power: 18%
Max loss with my risk management: ~$250
Req. Buy Power: $844 (max loss without management before expiry, no way to let this happen!)
Tasty IVR: 5.4
Expiry: 15 days
Buy 2 SMH May21' 230 Put
Sell 2 SMH May21' 235 Put
Credit PUT spread for 0.78cr each.
Stop/my risk management : Closing immediately if daily candle is closing BELOW the box, max loss in my calculations in this case could be 250$. Probability of loss in this way: ~12% .
Take profit strategy: 65% of max.profit in this case with auto sell order at 0.27db. Probability of profit this way: ~88%.
Of course I'll not wait until expiry in any case!
If you liked this article, check my other ideas.
Anyway: HIT THE LIKE BUTTON BELOW , and for fresh option ideas FOLLOW ME( @mrAnonymCrypto ) on tradingview !

Staying short SMHDaily stoch heading south
Beautiful engulfing candle
vol great
It broke 50 and 100 ma also
and closed on its low
Weekly stoch looks fantastic engulfing
Short at 244
support 224.41 breaks here
resistance is 239.71

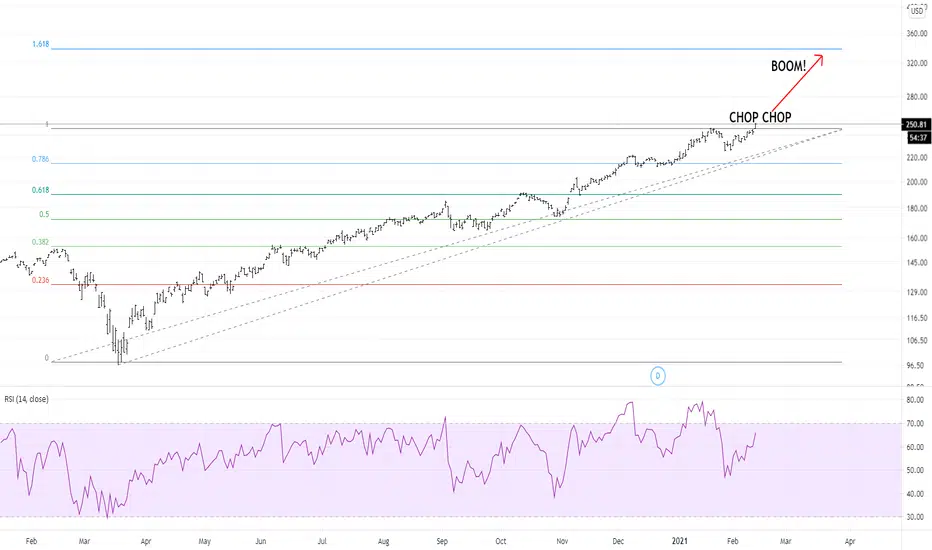
$SMH Tests Trendline Support as Chip Demand BoomsSMH is at an interesting juncture. The world will be defined by chips. Demand is soaring. Supply will eventually catch up. This pattern is typically part of a continuation in a trend. But it needs to continue to hold the trend to capitalize on the A-T breakout to come.

SMH Bull put spread - closed out as day trade for small profitSMH Bull put spread
Sold the 230-227.5 bull put spread for .42 which was 20% ROI and 3 DTE, and then the market quickly traded to .56 and .62 as the 236 zone dind't have any buyers.
So the lack of any buying activity made me lose confidence in the trade.
I bought the spread back for 0.38 for a 0.04 profit about 5 hours later and took it as a day trade.
I'll look to sell lower at the 220 strike if it tests down to 230 which I think is likely

3x ETF SOXL vs other 1x semi ETFs over various time horizonsI compare SOXL returns with SOXX, SMH, and PSI, all ETFs in the semiconductor space.
CONCLUSIONS AND FINDINGS:
YTD 2021 SOXL has not provided any net benefit over it's peers. And if you use stop loss orders you've probably lost money on it due to its extreme volatility. Smaller quant ETF fund PSI is the better performer on most/all time horizons YTD or more recent, especially from a risk/reward perspective. Only when comparing SOXL against the others on a time horizon of 1 yr or longer does SOXL outperform it's peers.
Importantly however, charts mimic real life only to the extent we make the purchase the entire position at once and don't touch it over the entire time frame. But this is not what most traders do. Thus, I recommend holding SOXL only if you're going to buy it and not set any stop loss orders, touch it, trade it, or even look at it for a year or more. But you probably can't handle that. I can't either. Thus the better, more realistic strategy for most traders is to get PSI or one of the other primary ETFs covering this space.

$SMH Triangle consolidation w pullback trigger $SMH broke out of triangle consolidation w pullback trigger zone

$SMH Cup with HandleSemiconductor stocks as tracked by $SMH ETF seem to have put in the low of their handle in a 2 months cup and handle pattern.


SMH, short term double top?Although nothing really pans out, i suspect a potential double top for Semiconductor ETF.
While lots of GOOD news such as good economic or job data, and shortage of chips should propel SMH even higher but
as contrarian, i would take opposite opinion for next 3 months for a short hiatus for retracement
if the double top plays out
the first down side target base on % projection will be ~216.
and if this neckline breaks down,
next projection target is around 181
as to whether it can go lower to ~152 for major major support, that i am not sure
only time will tell
Please do your own D.D.
Not a suggestion to buy or sell this etf, only for research purpose

SMH Bullish Flag PatternI'm seeing a flagish pattern develop on the hourly time frame, looks like it should resolve today or tomorrow.
NASDAQ:SMH


$SMH Semiconductors Remains a Battleground
Please take not of the significance of the February candle open, today it was where the battle between Bulls and Bears was fought,
unfortunately into the close the Bears came out on top and we closed below this key level.
If NVDA AMD etc are to rally this level needs to break on heavy volume and set up a recovery for the sector next week.
As the month end approaches it becomes even more important.

Semiconductor RallySMH, the semiconductor ETF has completed a beautiful combo correction and it appears wave 1 and 2 are already in!
Trade plan
Entry- Break of first supply zone
Stop loss- Will take loss if price cannot turn supply into demand
Price target- Overall price target for Wave 3 is 260, but I will be scalping in between the overall move to 260 using the zones as price targets and stop losses
Comment with any questions regarding the chart or trade plan :)


SMH: Not Smart to Long Semiconductor Index Right NowIt is not a smart decision to open long positions in the semiconductor sector right now (TSM, NVDA, ASML, INTC, AAMT, AMD... etc).
As the chart show, the overall performance on SMH is still on the downside trend, blocked by the resistance line on the necklace of the head-shoulder pattern.
But it doesn't mean that it is time to short the semiconductor sector, it is better to stay neutral and see if we have the chance to buy the cheap chip in around 200 USD.
If the market wouldn't give us the chance to buy in deep, then we can try to create the new positions again when SMH breaks through the resistance and goes with a new uptrend.

$SMH Semiconductor ETF Holds Trendline
Lots of pain among the tech bulls in recent weeks and the SMH has been the cause of much of that pain.
Despite a unprecedented demand and pricing power the sector is unable to meet demands as deep rooted politics has caused supply chain issues.
Earning beats have been ignored as guidance has failed to overwhelm analysts and investors.
This week we must look for strength in AMD and NVDA in particular, both companies have seen considerable outflows and attempted rallies have been rejected fast.
On a positive note the SMH has maintained its March 2020 uptrend, it retraced and held the 0.236 Fibonacci level and also held the 100ma (ema) .
All 2 of these supports is now the line in the sand for us, below these supports trouble is ahead.

Semis to the moonLONG NVDA LONG TSM LONG KLAC LONG SEMIS!!!!!!!!!!!!!!!!!!!!!!!!!!!!!!!!!!!!!!!!!!!!!!!!!!!!!!!!!!!!!!!!!!!!!!!!!!!!!!!!!!!!!!!!!!!!
But seriously, semis have broken out. I expect a test, but clearly semis have both cyclical and secular tailwinds. It is a no brainer to go long in a "bet the farm" type bet.
Semiconductors ~ ascending triangle Technical Analysis
We have formed an ascending triangle (purple lines). If we make a measured move from the breakout, it takes us up to $275 target approximately.
21ema has been working very well as a trend following system.
OBV has been supportive of the trend.
Fundamental Analysis / News
1. Ongoing reports talking about demand for semiconductors outpacing supply, particularly from the auto makers.
2. A Reuters report that indicates CEOs of leading U.S. companies are urging the Biden administration to provide incentives to build more factories in the U.S. in order to win back market share and help mitigate risks to national security.

How I use daily weekly stoch Part 2 Swing tradingSPY 385 the 360 then boom new highs or we boom from here
all up to banks earnings.
