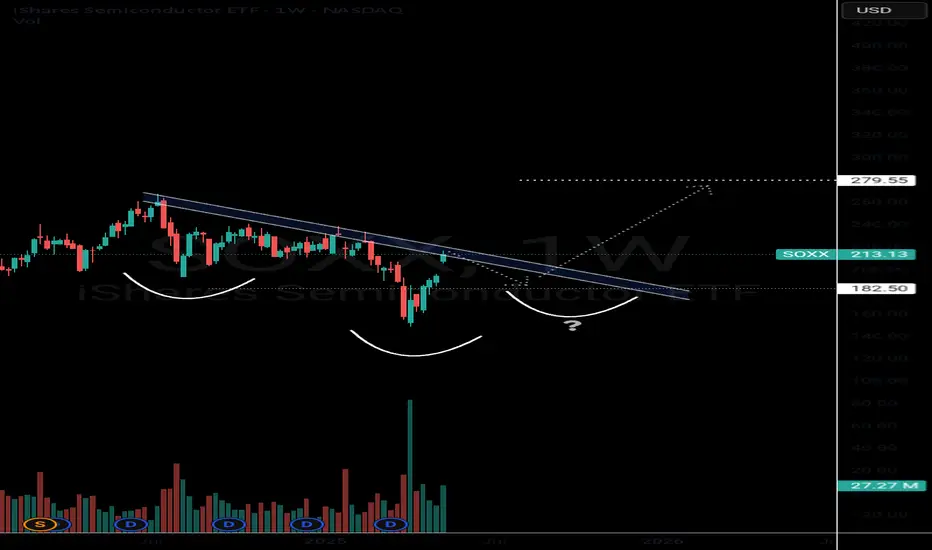
SOXX: Classic textbook movejust hitting resistance, nothing more for now.
That’s a clean trendline test on SOXX: strong bounce, but right at the line that’s been a ceiling since early 2024. Looks more like rejection than anything else. Price will sort it out soon.
Key stats
About ISHARES TRUST
Home page
Inception date
Jul 10, 2001
Structure
Open-Ended Fund
Replication method
Physical
Dividend treatment
Distributes
Distribution tax treatment
Qualified dividends
Income tax type
Capital Gains
Max ST capital gains rate
39.60%
Max LT capital gains rate
20.00%
Primary advisor
BlackRock Fund Advisors
Distributor
BlackRock Investments LLC
SOXX is passively managed to provide concentrated exposure to the 30 largest US-listed semiconductor companies. This includes (i) manufacturers of materials with semiconductors that are used in electronic applications or in LED and OLED technology and (ii) providers of services or equipment associated with semiconductors. To be eligible for the index, companies must meet investability and liquidity requirements, including a minimum market-cap of $100 million. The index employs market-cap-weighting with a capping methodologythe weights of the top five securities are capped at 8% and the remaining securities at 4%. SOXX may also hold ADRs, whose cumulative weight in the index is capped at 10%. The fund uses a sampling strategy to track its index, which is reconstituted annually and rebalanced on a quarterly basis. Prior to June 21, 2021, the fund was named iShares PHLX Semiconductor ETF and tracked the PHLX Semiconductor Sector Index
Related funds
Classification
What's in the fund
Exposure type
Electronic Technology
Stock breakdown by region
Top 10 holdings

Bullish Semiconductors? SOXX The semiconductors NASDAQ:SOXX definitely tend to lead the market In bull rallies. I still think this saying will hold true for several years.
The NASDAQ:SOXX is flirting with some pretty decent resistance. This would be a perfect spot for sellers to exit and price action to digest recent gain
Triple leveraged insanity?!?!?!Thinking about taking a swing with AMEX:USD USD (Ultra Semiconductors) if we can get sharply down to this line. What do you all think?
This is not for a HODL. This is intended to be a short-term leveraged swing trade. Keep your diamond hands to yourself plz and thank you.

SOXX 3d, 1H 2025NASDAQ:SOXX is painting what I think is a topping pattern. I am expecting this to pull a similar move to AMEX:ARKK back in Q4 2021.
If this plays out how I see playing out, I could see this revisiting the $180 area in the next 4-5 months.
For reference:

SOXX ETF pick for Year 2025.SOXX will be my ETF pick for 2025, aligning with the anticipated policy direction under Trump.
I will review its performance in mid-2025 and provide an update again at the end of 2025.
It’s worth noting that Tesla is not included in this ETF. To ensure a balanced approach, I plan to allocate 80% o

SOXX - Time to begin DCANot financial advice. This is my creativity at play. This is all my own opinion to myself, this is just like my personal portfolio but I like to share for other people’s case studies
Broke out of head and shoulders. Still in a wedge so it could break out or go back down to 205 for re test of the b

SOXX Bull Flag #2I posted a longer term bull flag for SOXX on the top 5 list this week, but here's another shorter term one on the 15m within the larger one. Nice recovery today back up into the wedge, Good potential to breakout and head to the top end of the larger bull flag which could lead to even more upside if

Top 5 Weekly Trade Ideas #2 - SOXX Bull FlagRough day for tech and semis so far. NVDA failed to reclaim $140 but still has a bullish chart overall. It was idea #1 this week with an inverse H&S that is still valid for now. If we see both NVDA and SOXX begin to rally it would be a good sign that SOXX is about to breakout of this bull flag while

Market near Top. SOXX is showing weakness.So first off, I am expecting a recession to begin in the next year.
I know, people have been saying this for years and I've been laughing at them for years. So many idiots thought that a recession begins once the yield curve inverts lol.
Well there's several things I've been watching for a recessio

SOXX Trend Retest Short IdeaThis is one of my 5 favorite setups this week that I went over in my video yesterday. I haven't had time to post the text versions yet so I'm doing it now. SOXX just rejected off of a major trendline retest, just like it has several times in the past and it has always led to continued downside. We'l

See all ideas
Summarizing what the indicators are suggesting.
Oscillators
Neutral
SellBuy
Strong sellStrong buy
Strong sellSellNeutralBuyStrong buy
Oscillators
Neutral
SellBuy
Strong sellStrong buy
Strong sellSellNeutralBuyStrong buy
Summary
Neutral
SellBuy
Strong sellStrong buy
Strong sellSellNeutralBuyStrong buy
Summary
Neutral
SellBuy
Strong sellStrong buy
Strong sellSellNeutralBuyStrong buy
Summary
Neutral
SellBuy
Strong sellStrong buy
Strong sellSellNeutralBuyStrong buy
Moving Averages
Neutral
SellBuy
Strong sellStrong buy
Strong sellSellNeutralBuyStrong buy
Moving Averages
Neutral
SellBuy
Strong sellStrong buy
Strong sellSellNeutralBuyStrong buy
Displays a symbol's price movements over previous years to identify recurring trends.
Frequently Asked Questions
An exchange-traded fund (ETF) is a collection of assets (stocks, bonds, commodities, etc.) that track an underlying index and can be bought on an exchange like individual stocks.
SOXX trades at 242.00 USD today, its price has risen 1.67% in the past 24 hours. Track more dynamics on SOXX price chart.
SOXX net asset value is 246.12 today — it's risen 8.70% over the past month. NAV represents the total value of the fund's assets less liabilities and serves as a gauge of the fund's performance.
SOXX assets under management is 13.98 B USD. AUM is an important metric as it reflects the fund's size and can serve as a gauge of how successful the fund is in attracting investors, which, in its turn, can influence decision-making.
SOXX price has risen by 16.10% over the last month, and its yearly performance shows a −6.56% decrease. See more dynamics on SOXX price chart.
NAV returns, another gauge of an ETF dynamics, showed a 42.92% increase in three-month performance and has decreased by −6.64% in a year.
NAV returns, another gauge of an ETF dynamics, showed a 42.92% increase in three-month performance and has decreased by −6.64% in a year.
SOXX fund flows account for −4.09 B USD (1 year). Many traders use this metric to get insight into investors' sentiment and evaluate whether it's time to buy or sell the fund.
Since ETFs work like an individual stock, they can be bought and sold on exchanges (e.g. NASDAQ, NYSE, EURONEXT). As it happens with stocks, you need to select a brokerage to access trading. Explore our list of available brokers to find the one to help execute your strategies. Don't forget to do your research before getting to trading. Explore ETFs metrics in our ETF screener to find a reliable opportunity.
SOXX invests in stocks. See more details in our Analysis section.
SOXX expense ratio is 0.35%. It's an important metric for helping traders understand the fund's operating costs relative to assets and how expensive it would be to hold the fund.
No, SOXX isn't leveraged, meaning it doesn't use borrowings or financial derivatives to magnify the performance of the underlying assets or index it follows.
In some ways, ETFs are safe investments, but in a broader sense, they're not safer than any other asset, so it's crucial to analyze a fund before investing. But if your research gives a vague answer, you can always refer to technical analysis.
Today, SOXX technical analysis shows the buy rating and its 1-week rating is buy. Since market conditions are prone to changes, it's worth looking a bit further into the future — according to the 1-month rating SOXX shows the buy signal. See more of SOXX technicals for a more comprehensive analysis.
Today, SOXX technical analysis shows the buy rating and its 1-week rating is buy. Since market conditions are prone to changes, it's worth looking a bit further into the future — according to the 1-month rating SOXX shows the buy signal. See more of SOXX technicals for a more comprehensive analysis.
Yes, SOXX pays dividends to its holders with the dividend yield of 0.67%.
SOXX trades at a premium (0.48%).
Premium/discount to NAV expresses the difference between the ETF’s price and its NAV value. A positive percentage indicates a premium, meaning the ETF trades at a higher price than the calculated NAV. Conversely, a negative percentage indicates a discount, suggesting the ETF trades at a lower price than NAV.
Premium/discount to NAV expresses the difference between the ETF’s price and its NAV value. A positive percentage indicates a premium, meaning the ETF trades at a higher price than the calculated NAV. Conversely, a negative percentage indicates a discount, suggesting the ETF trades at a lower price than NAV.
SOXX shares are issued by BlackRock, Inc.
SOXX follows the NYSE Semiconductor Index - Benchmark TR Gross. ETFs usually track some benchmark seeking to replicate its performance and guide asset selection and objectives.
The fund started trading on Jul 10, 2001.
The fund's management style is passive, meaning it's aiming to replicate the performance of the underlying index by holding assets in the same proportions as the index. The goal is to match the index's returns.