SPXL shortAfter SPY quick Up, there might be downside move.
Short entry 159
Stop 163,
Target 130, 100
Risk management is much more important than a good entry point.
I am not a PRO trader.
In my trading plan, the Max Risk of each short term trade should be less than 1% of an account.
Key stats
About DIREXION SHARES ETF TRUST
Home page
Inception date
Nov 5, 2008
Structure
Open-Ended Fund
Replication method
Synthetic
Dividend treatment
Distributes
Distribution tax treatment
Ordinary income
Income tax type
Capital Gains
Max ST capital gains rate
39.60%
Max LT capital gains rate
20.00%
Primary advisor
Rafferty Asset Management LLC
Distributor
Foreside Fund Services LLC
SPXL, as a levered product, is not a buy-and-hold ETF, it's a short-term tactical instrument for getting 3x exposure to the S&P 500. The fund gets the added exposure by using futures contracts and other derivatives. The underlying companies are among the biggest and most well-known in the world. Importantly, the implication of SPXL's daily rebalancing is that holding-period returns longer than a day are unlikely to resemble 3x exposure to the S&P 500. Shorter holding periods increase the importance of trading costs relative to yearly management costs, which are fairly high but average for this segment. Over longer periods, returns can vary significantly from 2x exposure to its underlying index
Related funds
Classification
What's in the fund
Exposure type
Electronic Technology
Technology Services
Finance
Cash
Stock breakdown by region
Top 10 holdings

SPXL – Bullish Structure Reclaim in ProgressNice setup right here — this multi-timeframe view of SPXL (S&P 500 3x Bull ETF) paints a compelling story, especially with how clean that 0.382 level at $126.23 is holding across multiple frames.
⚡SPXL – Bullish Structure Reclaim in Progress
Don’t miss what’s happening on this chart.
📍Price just

We have 3 reasons to here
1. There is a megaphone pattern almost finished (A).
2. A broadening wedge is forming at a high level (B).
3. Another broadening wedge is nearing completion (C).
So, what I think is that Trump will announce something interesting to end the commercial conflict with everyone.
We will see a market

Opening (IRA): SPXL March 21st 154 Covered Call... for a 151.04 debit.
Comments: Selling the -84 call against shares to emulate the delta metrics of a 16 delta short put, but with the built-in defense of the short call. (In all honesty, this is just an attempt to keep my theta/net liquidity ratio above .05, which is kind of the minimum of whe

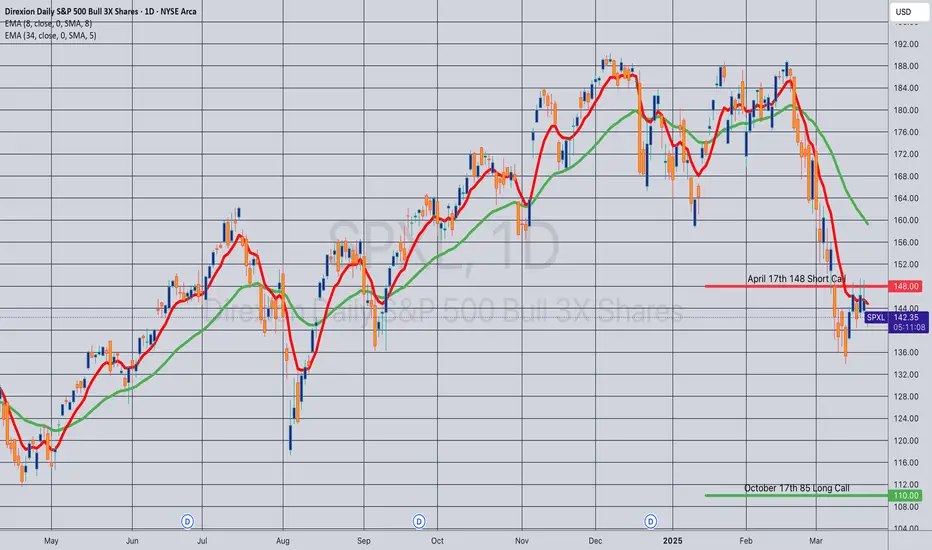
Opening (IRA): SPXL April 17th 148/October 17th 85 LCD*... for a 56.84 debit.
Comments: Looking to be a little bit more buying power efficient here ... . Buying the back month 90 delta and selling the front month that pays for all the extrinsic of the long.
Metrics:
Buying Power Effect: 56.84
Break Even: 141.84
Max Profit: 6.16
ROC at Max: 10.84%
5
SPXL , 2025 Trades LOG Just noting all my price action entry's and exits in the comments at the end of every day and result , perhaps a logic explanation too on why I bought or sold ....
This or TQQQ is a great alternative to something like futures that is much more scalable .
My goal is to update this every day as a l

15% Correction Starting Why Look TNXGuys I believe tops in 608 I am know 100% short
SPXL 171 Target 70. It wont be straight down
we will have relief rally in between just watch charts

SPXL - SPX - Were not done yetOn the SPXL I can see using TA plus fibs that it looks like another leg up is coming. Usually things don't top at the 1.4 fib but continue to the 1.618 fib. Doomers are out in full force which happens at every local bottom. Yes we are getting up here but doesn't mean we can't go higher yet and looki

Top is in I am know Short SPXL 181.50 NVDA 148.62 long SOXS18.96The video explains TA wise we have topped
Be doing video updates daily show how transfer from that SPXL long 28% to know catch short.

SPXL bouncing at .618 & .5 retrace area BOUNCE?MODs have suggested that I provide more detail about the picks I make.
Sorry. I'm not as verbose as y'all, and I don't like things to be complicated.
My trading plan is very simple.
I buy or sell at top & bottom of parallel channels.
I confirm when price hits Fibonacci levels.
Bonus if a TTM Sq

See all ideas
Summarizing what the indicators are suggesting.
Oscillators
Neutral
SellBuy
Strong sellStrong buy
Strong sellSellNeutralBuyStrong buy
Oscillators
Neutral
SellBuy
Strong sellStrong buy
Strong sellSellNeutralBuyStrong buy
Summary
Neutral
SellBuy
Strong sellStrong buy
Strong sellSellNeutralBuyStrong buy
Summary
Neutral
SellBuy
Strong sellStrong buy
Strong sellSellNeutralBuyStrong buy
Summary
Neutral
SellBuy
Strong sellStrong buy
Strong sellSellNeutralBuyStrong buy
Moving Averages
Neutral
SellBuy
Strong sellStrong buy
Strong sellSellNeutralBuyStrong buy
Moving Averages
Neutral
SellBuy
Strong sellStrong buy
Strong sellSellNeutralBuyStrong buy
Displays a symbol's price movements over previous years to identify recurring trends.
Frequently Asked Questions
An exchange-traded fund (ETF) is a collection of assets (stocks, bonds, commodities, etc.) that track an underlying index and can be bought on an exchange like individual stocks.
SPXL trades at 177.40 USD today, its price has fallen −0.28% in the past 24 hours. Track more dynamics on SPXL price chart.
SPXL net asset value is 178.04 today — it's risen 9.95% over the past month. NAV represents the total value of the fund's assets less liabilities and serves as a gauge of the fund's performance.
SPXL assets under management is 5.43 B USD. AUM is an important metric as it reflects the fund's size and can serve as a gauge of how successful the fund is in attracting investors, which, in its turn, can influence decision-making.
SPXL price has risen by 12.28% over the last month, and its yearly performance shows a 22.01% increase. See more dynamics on SPXL price chart.
NAV returns, another gauge of an ETF dynamics, have risen by 9.95% over the last month, showed a 49.47% increase in three-month performance and has increased by 12.80% in a year.
NAV returns, another gauge of an ETF dynamics, have risen by 9.95% over the last month, showed a 49.47% increase in three-month performance and has increased by 12.80% in a year.
SPXL fund flows account for 404.22 M USD (1 year). Many traders use this metric to get insight into investors' sentiment and evaluate whether it's time to buy or sell the fund.
Since ETFs work like an individual stock, they can be bought and sold on exchanges (e.g. NASDAQ, NYSE, EURONEXT). As it happens with stocks, you need to select a brokerage to access trading. Explore our list of available brokers to find the one to help execute your strategies. Don't forget to do your research before getting to trading. Explore ETFs metrics in our ETF screener to find a reliable opportunity.
SPXL invests in stocks. See more details in our Analysis section.
SPXL expense ratio is 0.87%. It's an important metric for helping traders understand the fund's operating costs relative to assets and how expensive it would be to hold the fund.
Yes, SPXL is a leveraged ETF, meaning it uses borrowings or financial derivatives to magnify the performance of the underlying assets or index it follows.
In some ways, ETFs are safe investments, but in a broader sense, they're not safer than any other asset, so it's crucial to analyze a fund before investing. But if your research gives a vague answer, you can always refer to technical analysis.
Today, SPXL technical analysis shows the buy rating and its 1-week rating is buy. Since market conditions are prone to changes, it's worth looking a bit further into the future — according to the 1-month rating SPXL shows the buy signal. See more of SPXL technicals for a more comprehensive analysis.
Today, SPXL technical analysis shows the buy rating and its 1-week rating is buy. Since market conditions are prone to changes, it's worth looking a bit further into the future — according to the 1-month rating SPXL shows the buy signal. See more of SPXL technicals for a more comprehensive analysis.
Yes, SPXL pays dividends to its holders with the dividend yield of 0.90%.
SPXL trades at a premium (0.57%).
Premium/discount to NAV expresses the difference between the ETF’s price and its NAV value. A positive percentage indicates a premium, meaning the ETF trades at a higher price than the calculated NAV. Conversely, a negative percentage indicates a discount, suggesting the ETF trades at a lower price than NAV.
Premium/discount to NAV expresses the difference between the ETF’s price and its NAV value. A positive percentage indicates a premium, meaning the ETF trades at a higher price than the calculated NAV. Conversely, a negative percentage indicates a discount, suggesting the ETF trades at a lower price than NAV.
SPXL shares are issued by Rafferty Asset Management LLC
SPXL follows the S&P 500. ETFs usually track some benchmark seeking to replicate its performance and guide asset selection and objectives.
The fund started trading on Nov 5, 2008.
The fund's management style is passive, meaning it's aiming to replicate the performance of the underlying index by holding assets in the same proportions as the index. The goal is to match the index's returns.