Here's what we've got going into next weekSo here's what I see going into next week, The SPY is in a tight little area and what that means is expect extreme volatility, we break to the downside were heading to the gap, if we break to the upside we're going to new all time highs, my bias is to the down side because we've got a lot of bad news coming in especially with China Looking at Taiwan, also it seems market sentiment Is to the downside, but darn it this thing still keeps climbing higher. I'm going to be going short and buying put options,,this is in my opinion, and what I am doing for myself,, you do you, do your own analysis and research. I blame no one for my mistakes, Even though I would like to, but nobody makes me buy or sell, I am the one that must enter that order and I take responsibility for my actions, I have come to learn that I am gifted with making money on the short term scalping markets, but will quickly become a loss because I hold on longer, my education has costed me thousands and thousands of dollars over the decades, And I am still learning, Praise be to God.
SPY trade ideas

Stock Market Forecast | TSLA NVDA AAPL AMZN META MSFTStock Market Forecast | CME_MINI:NQ1! CME_MINI:ES1! SPY QQQ
Mag 7 Forecast | NASDAQ:TSLA NASDAQ:NVDA AAPL AMZN META MSFT GOOGL

SPY to touch 600 soon Looks like it's in a large rising wedge, which should resolve upwards imho
Yesterday was another buy the dip moment, as bulls defended a break below 583 and rallied all the way up to the 591 level.
A break above 600 which lead to explosive price action which may or may not happen, however 600 is a strong psychological resistance. We will see how this pattern develops...

BREAKING $SPY Ultra Rare Holy GrailBREAKING AMEX:SPY Ultra Rare Holy Grail
Inside week trap is here a massive breakout is coming!
The key is to watch the futures open all will be alerted here on TV no charge
Low risk high reward setups only ill share it all going for 6 figures
All I ask is drop a 👍

SPY (S&P 500 ETF) – Fibonacci Reversal + Bullish Continuation SeThis chart highlights a potential retracement zone before a major continuation leg to the upside, based on Fibonacci levels and price structure.
📊 Technical Breakdown
Current Price: $589.39
Recent High: $595.54 (Fibonacci 1.0)
Key Fibonacci Levels:
0.618 → $562.28 (First retracement target)
0.5 → $555.57
0.382 → $547.38
Critical Support: $552.15 (confluence with historical demand & fib zone)
Projected Target (1.382 Fib Extension): $629.02
🧠 Probabilistic Interpretation
🔻 Short-term pullback toward $552.15 = 60% probability based on multiple rejections from 0.886/1.0 Fib zones.
🔼 Continuation to $629.02 = 70% probability if price finds support at golden ratio (0.618) or 0.5 zone.
🧠 Structure favors smart money re-accumulation after engineered liquidity grab.
🌐 Macro Context (as of May 31, 2025)
Fed Watch: Market pricing in 70% chance of no rate cut in June. July data will be crucial.
VIX: Suppressed, but starting to rise—indicative of market hedging short-term volatility.
Earnings season: Mixed signals—AI sector outperforms while cyclicals lag.
🚨 Trade Plan for Professionals
Watch for price action near $555–552.
Enter long upon bullish engulfing or SMC confirmation at demand zone.
First TP: $595.50
Final TP: $628.80–$629.02
SL: Below $541.72 (Fib 0.382)
🧠 Final Note
This chart reflects a classic Fibonacci retracement & extension structure that institutional traders often monitor. Aligns with DSS and WaverVanir’s discretionary outlook.
#SPY #SMP500 #FibLevels #SmartMoney #LiquiditySweep #WaverVanir #TechnicalAnalysis #FibonacciTrading #TradingView

SpyGoing over
Spy
Dow jones
NYA
I'll keep this mostly cylicals and broader market.. I've written up a qqq post where I cover most tech indexes..
Let's start with NYSE or TVC:NYA
This covers 3000 stocks.. you ever read about weak breadth in the market? Well when ever this is Lagging behind nasdaq and the market is being dragged along by 6 tech stocks then that's what it means.
Ok so last week when the Spy dumped from 595 to 575 in 2 days, a big part of that was NYA ran into a brick wall here at 20,000 as you can see. Add to that price had formed a rising wedge from the melt up from April lows..
So price rejected at 20,000 on NYA but bounced at its 200sma similar to Spy at 575 which let's you know how connected the 2 are
So now we go into this week here literally 1% away from that same resistance.. Nothing moves NYA and IWM more than the monthly jobs, this is because Job numbers reflect economic strength and a weaker economy will impact Cylicals and small caps the most ..
I don't think we break above that trendline resistance, too much uncertainty around Tariffs, Also here's the weekly RSI on NYA dating back 2yrs
At resistance and divergent... I think we break below the 200sma this week Either with Wed ADP or Friday nonfarm payrolls..
Usually to get below the 200sma it takes a GAP down so that's why I think the action takes place pre market on some data.
TVC:DJI
Dow jones
I'm conflicted a little here.
Price is stuck below trendline resistance and 200ma
But price is also showing a possible bullish H&S inside a Pennant.
Dow jones would only be bullish above 43,000..
As you can see there is not anymore room fawk around.. price will break in either direction come next week..
I'm leaning to the bearish side here but things only get seriously bearish back below 40,000 because that would put it back inside that April box
2 of the sectors that really moves the dow is Financials and Health
Look at this XLF weekly chart
Price is distributing at a 15yr resistance
Zoomed in
Looks like a 2022 repeat about to happen as early as this fall
The position XLF is in makes me doubt Financials will lend a boosting hand here .
XLV - health care on the other hand looks really bullish short term
Daily channel shows a 7% upside to channel top
Daily rsi showing bullish Divergence
So health could offset some of the dow losses but not enough if tech and Financials rollover.
Lastly my number one reason I'm bearish on the dow is DJT or dow jones transportation
Weekly candle stuck below 15,000, trendline resistance , 20 and 200ma.
Seasonality June and July is bullish for DJT because of the traveling but if they can't break above this area in the middle of its best seasonality then nothing is safe
Lastly Spy
ALWAYS KNOW WHERE YOUR MOVING AVERAGES ARE BEFORE YOU TAKE A TRADE!
Me personally I only use 20,50,200.. EMA and SMA.
I say this because the area of spy 572-577 has a powering of moving averages on both weekly and daily time frames
If spy breaks below 570 then we are headed straight for this box.
547-550
Below that and it's death for the bulls.. if it bounces there then we'll see what happens
Weekly RSI same as NYA .. at resistance
So here's a 4 hr chart..
As you can see, rising wedge..
But pay attention to the yellow trendline resistance. That range is 590-584..
A open below 582 and it's a short to 575..
A open above 593 and it's one last long to 600 before the big short
585-592 is choppy and I wouldn't trade it
Like I said earlier, you normally never see price intra day slide below the daily 200sma .. so if they are going to break below 575 this week ( I believe) then they will do it pre market.
I don't think this week will be all doom and gloom. Why? Because of NQ 4hr moneyflow.. it's gotten too oversold so they are likely to have a tech pop this week probably Tues or wed which I think will be your opportunity to position short


$SPY demand zone: Chinese+Canada+Mexican tariffsDaily SPY demand zone is $581-$586, lots of buys within that range. We´d need a major and negative catalyst to break lower than that, especially with the daily 200ma @$577.
Worsening China tariff and regressive trade news next week to push SPY to it´s $577 200 MA or at least some positive news from the Canadian and Mexican pause ending June 9th to at least continue to hold us at the higher end of the range ?

GAP Fill on the table. We going lower according to the DSSDSS predicted the right moment in time. Time series analysis combined with my technical insight could be my edge that's working right now.
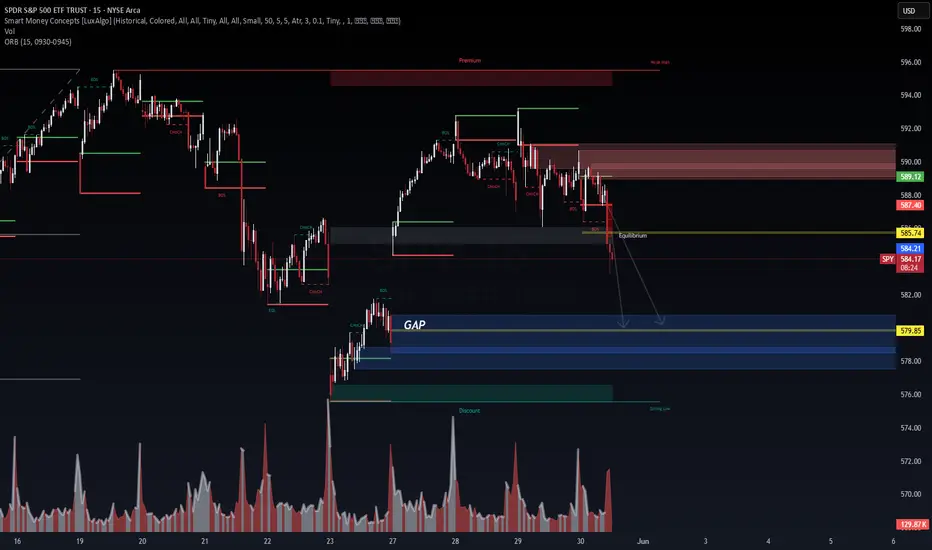
SPY Breakdown Watch – Smart Money Concepts (1H Chart)🔎 Chart: SPY | TradingView 1H
At Wavervanir International LLC, our discretionary analysis on SPY (S&P 500 ETF) using SMC + ORB logic is signaling potential downside.
🔍 Market Structure:
CHoCH (Change of Character) confirmed after BOS (Break of Structure), suggesting buyer exhaustion.
Premium zone rejection with multiple failed attempts to reclaim the weak high.
Liquidity has shifted toward discount zones, aligning with volume imbalance and OB zones below.
🎯 Target Zones:
Immediate liquidity pool: 579.85
Demand block confluence: 575–565 zone
Deep mitigation OB: 560–557.50 zone
📊 Macro Context:
Bond volatility rising (MOVE index)
Fed holding rates steady, inflation stickiness remains
Liquidity tightening into quarter-end
🧠 Strategic View:
SPY looks poised to fill inefficiencies into the 575–565 range unless macro tailwinds emerge. Volume supports this as market seeks equilibrium post-premium rejection.

SPY: Maybe today we could see this. Just a random thought and analysis. Would be fun if we see this waterfall today.

2007 Top /2025 day 38td t-minus 2.5 days Major TOP The chart in focus is the 2007 chart we are now day 38 in the pattern and in 2007 we took 40td to make a new high And I have posted my models .I see the next rally to reach anywhere from 6035/on the low end to 6177 on the high end focus 6147 where Ax 1.618 = wave C or 3 Best of trades WAVETIMER

Opening (IRA): SPY September 19th 500 Short Put... for a 5.02 credit.
Comments: Adding at intervals at strikes better than what I currently have on, targeting the <16 delta strike paying around 1% of the strike price in credit. Will look to manage positions as I come to them.

$SPY // May 30 2025 // Analysis & Targets for Day TradersAMEX:SPY // May 30 2025 // Analysis & Targets for Day Traders

SPY/QQQ Plan Your Trade for 5-30 : CRUSH PatternToday's CRUSH pattern should result in a continued downward price trend in my analysis is accurate. I have seen CRUSH pattern trend upward sometimes. So, please understand I'm reading the chart and pattern as a rolling top type of pattern leading to a CRUSH (downward) price trend today.
I highlight the potential for a FAILED CRUSH (downward) price bar - whereas a reversion back to the upside is a potential. But, I estimate that potential at only 20-25% at this time.
My analysis suggests the breakdown in price will likely continue, and we'll likely see the SPY/QQQ/Bitcoin continue to try to trend downward.
Gold and Silver are moving into a fairly solid Gap-Stall-Revert-Flush pattern that may see Gold attempt to rally back above $3400 today. Silver is currently trading very close to a STDDEV Reversion level, so Silver may not see a big move today (like Gold).
I'm hopeful we start to see a big breakaway move in Gold/Silver today and carry into next week.
My TTScanner algos generated new BUY triggers for GDX, GDXJ, and NUGT yesterday. That's a very good sign we are getting into a BUY/BULLISH mode in metals again.
I got up late today. Somehow, my alarms got turned off.
Happy Friday.
Get some.
#trading #research #investing #tradingalgos #tradingsignals #cycles #fibonacci #elliotwave #modelingsystems #stocks #bitcoin #btcusd #cryptos #spy #gold #nq #investing #trading #spytrading #spymarket #tradingmarket #stockmarket #silver

Finally A pull Back But How FarOk guys bad news on market; what we need is another 1 day or 2 sell off to be confirm direction change
I believe gaps will be filled if they past the fill part then bye bye market

Nightly $SPY / $SPX Scenarios for May 30, 2025🔮 Nightly AMEX:SPY / SP:SPX Scenarios for May 30, 2025 🔮
🌍 Market-Moving News 🌍
🤝 Debt-Ceiling Deal Advances
The U.S. House passed a bipartisan framework extending the federal borrowing limit through September, easing immediate default fears and lifting risk assets.
📉 Bond Yields Retreat
After surging above 4.6% earlier this week, the 10-year Treasury yield dipped back toward 4.5%, helping equities recover from recent rate-driven pullbacks.
⛽ Oil Inventories Jump
API data showed a 5.2 million-barrel build in U.S. crude stocks last week, sending oil prices lower and weighing on energy sector names.
🚗 Tesla Price Cut Spurs EV Rally
Tesla ( NASDAQ:TSLA ) cut Model 3 prices by 3% in the U.S., igniting a broader EV stock rally as investors priced in renewed demand ahead of summer driving season.
📊 Key Data Releases 📊
📅 Friday, May 30:
8:30 AM ET: Personal Consumption Expenditures (PCE) Price Index for April
Measures core inflation trends—Fed’s preferred gauge of consumer-price pressures.
10:00 AM ET: Pending Home Sales for April
Tracks signed contracts on existing homes; a leading indicator for the housing market.
⚠️ Disclaimer:
This information is for educational and informational purposes only and should not be construed as financial advice. Always consult a licensed financial advisor before making investment decisions.
📌 #trading #stockmarket #economy #news #trendtao #charting #technicalanalysis


The TACO Trade Is Back!🌮 AMEX:SPY
📊 The Setup:
The TACO trade ("Trump Always Chickens Out") continues to prove its resilience in the face of trade war headlines. The market dips sharply when tariffs are announced, and then surges back up as the news cycle turns, with Trump pausing or reversing his decisions.
We’ve seen multiple examples of this year-to-date on the AMEX:SPY chart:
🔹 Trump Pauses Tariffs for Canada & Mexico – market bounces.
🔹 Trump Pauses Most Liberation Day Tariffs – another bounce.
🔹 Trump Floats Lowering Tariffs on China – bounce continues.
🔹 Trump Pushes Back EU Tariffs to July – market rips higher.
It’s as if every tariff tantrum is followed by an inevitable rebound. Could this be the pattern to trade around for the next few months?
At this point, it almost feels like we’re watching a predictable movie. Every new threat to impose tariffs or spark a trade war is just a scene in the “TACO” storyline, and the markets are starting to get used to the plot twist.
Are we playing into an endless loop of fear and relief? Is this time different, or just the same old TACO? How much longer can we trust that the market will “chicken out” and bounce back every time tariffs are floated?


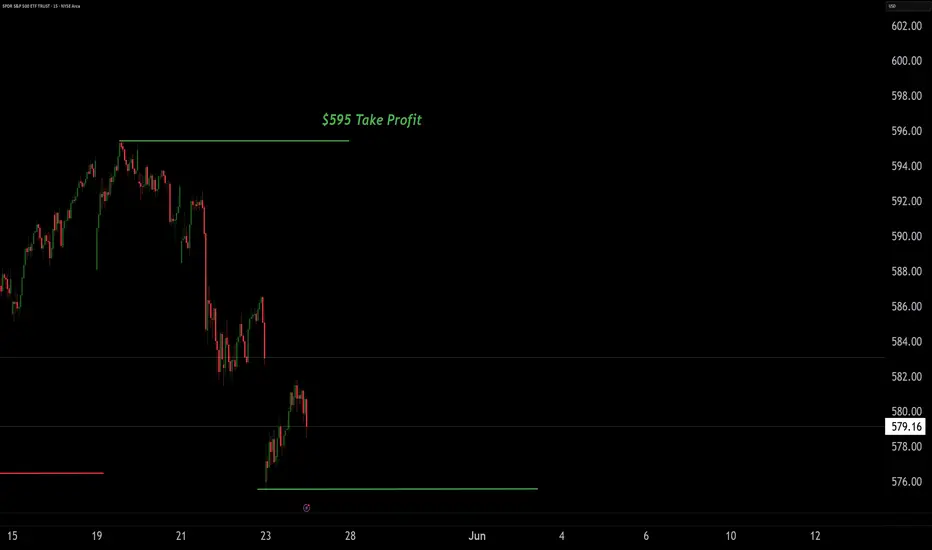
Spy Monthly Close $595-$602📈 May is on track to close bullish with projected levels of $595–$602.
This move is backed by the AlphaPulse™ Trading System:
– Momentum signals confirm multi-timeframe strength
– Anchored VWAP reclaimed from April highs
– MACD bull cross + RSI holding strong (60–70 zone)
– Price above SMA50/200 with elevated volume
– Fibonacci 1.618 aligns with $602 target
When anchored VWAP, MACD, RSI, volume, fibs, and AlphaPulse all align bullishly — and price structure supports clean higher lows — the probability of a May close between $595 and $602 becomes statistically favorable.
📈 Thesis Probability and Conditional Breakdown
🔷 Bullish Probability Estimate (May Close $595–$602):
📊 68% Probability of bullish continuation into $595–$602
Based on:
Multi-timeframe confluence (MACD, RSI, AVWAP)
No bearish divergences
Volume + smart money alignment (AlphaPulse Bot)
✅ Bull Case (If $580 Holds):
If price continues holding above $580, expect:
Continuation wave toward $595 (local fib target)
Acceleration into $602 (1.618 extension) if breakout holds above $596
Supported by:
AVWAP control staying bullish
MACD histogram expanding
RSI maintaining >60 zone
AlphaPulse breakout signal staying green
🎯 Target: $595–$602
📆 Timeframe: By May 30 close
🎯 Optional overshoot: $608 wick zone if volume spikes
⚠️ Bear Case Trigger (If $580 Breaks)
If $580 fails on high volume or with RSI divergence, the setup shifts:
Condition Bearish Implication
Break below $580 Invalidates current higher low base
MACD flips negative Signals momentum exhaustion
RSI < 50 Enters bearish zone
AlphaPulse Signal flips red Confirms structural breakdown
🔻 Downside Risk:
If $580 fails, probability of bearish retrace to $567 = 75%
$567 is the last demand support zone
Also aligns with prior consolidation + rising SMA50
Below this, momentum cracks completely, and macro selling may accelerate
🧠 Final Note:
“Above $580 = control remains with bulls.
Below $580 = structure breaks, and $567 becomes the likely magnet.”
AS always SafeTrades And JoeWtrades
Nightly $SPY / $SPX Scenarios for May 29, 2025 🔮 Nightly AMEX:SPY / SP:SPX Scenarios for May 29, 2025 🔮
🌍 Market-Moving News 🌍
🚫 U.S. Trade Court Blocks Tariffs
A federal trade court struck down key sections of President Trump’s steel and aluminum tariffs, sending U.S. stock futures sharply higher as investors anticipate reduced input costs for industrials and manufacturers
🌐 Markets Drift on Lack of Fresh Catalysts
Global equity markets showed muted moves today—stocks dipped and bond yields rose—as traders awaited new drivers of direction, with Nvidia’s ( NASDAQ:NVDA ) mixed earnings doing little to spark a decisive trend
📈 Bond Yields Climb, Pressuring Equities
The U.S. 10-year Treasury yield pushed above 4.6%, its highest in a month, on concerns over federal borrowing and fading rate-cut expectations, dragging the S&P 500 down more than 1% by midday
📊 Key Data Releases 📊
📅 Thursday, May 29:
8:30 AM ET: Advance Q1 GDP
Provides the first estimate of U.S. economic growth in Q1, a critical gauge of recession risk and Fed policy direction.
8:30 AM ET: Personal Income & Spending (April)
Tracks household earnings and outlays, offering insight into consumer resilience amid rising living costs.
⚠️ Disclaimer:
This information is for educational and informational purposes only and should not be construed as financial advice. Always consult a licensed financial advisor before making investment decisions.
📌 #trading #stockmarket #economy #news #trendtao #charting #technicalanalysis

SPY (S&P 500 ETF) – 1H Smart Money Concepts Short SetupPublished by WaverVanir International LLC | 28 May 2025
🧠 Smart Money Concepts | Volume Profile | Fibonacci Retracements | ORB (0930-0945)
🔻 Trade Context:
We positioned short around the 0.5–0.618 Fibonacci retracement zone near $588.50, aligning with a premium pricing zone and weak high rejection. Price structure has confirmed a Break of Structure (BOS) with a decisive move lower after liquidity sweep above previous highs.
🔍 Key Technicals:
📌 Positioned: $588.50–$589.00 zone
🔺 Weak High: $593.00+
📉 Short Target Zone:
TP1: $575.59 (0.886 retracement support)
TP2: $568.00–$563.22 (1.382 extension zone)
TP3: $558.61 (Volume cluster low and liquidity magnet)
⚖️ Equilibrium & Volume Confirmation:
Notice how equilibrium aligns with the lower range compression. Volume divergence adds confluence for downside continuation.
🎯 Outlook:
We're anticipating a move toward the 1.382–1.786 extension zones, with $563.22 as the primary short target. This aligns with internal liquidity pockets and previous consolidation zones.
📊 Strategy:
High-conviction SMC short with FVG alignment, premium rejection, and structural confirmation. Risk is tightly managed above the weak high. DSS confirms bearish momentum build-up.
💼 Trade Ideas & DSS-backed Analysis by
WaverVanir International LLC
#SPY #TradingView #SMC #AlgoTrading #Fibonacci #ORB #SmartMoney #ShortSetup #WaverVanir #VolumeProfile #MarketStructure
