Are you ready for this scenario?? BUY THE NEXT BOTTOM!!!Spx is gonna drop hard, are you ready to buy the next bottom?
I expect SPX to reach 4,440 atleast... NASDAQ, BITCOIN are gonna drop hard too...
BUY EVERYTHING IN 2026/2027 AND ENJOY THE NEXT CYCLE.
SPY trade ideas

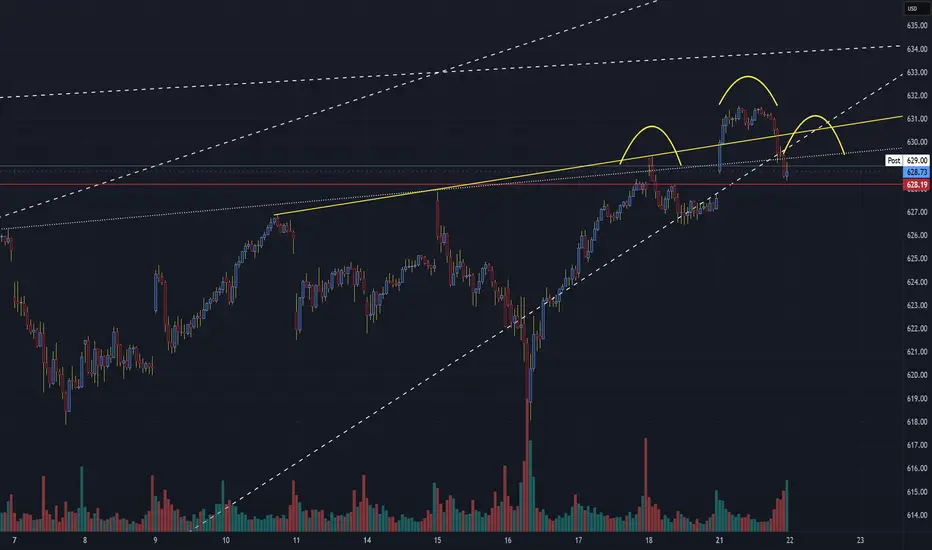
SPY Forming A Bearish Head and Shoulders PatternSPX Technical Update – Bearish Watch
Chart Focus: S&P 500 Index (30-Min Chart)
Date: July 21, 2025
🧠 Pattern Watch: Classic Head & Shoulders Formation
A clear head and shoulders pattern has emerged on the short-term 30-minute chart, signaling a potential bearish reversal after the recent uptrend.
Left Shoulder: Around 630.75
Head: Peaked near 633.00
Right Shoulder: Capped just under 631.00
Neckline: Sits near the 628.75–628.20 zone, marked by a yellow upward-sloping trendline and tested support.
📉 Bearish Breakdown in Play
The price has now broken below the neckline zone at 628.75 with increasing volume — an early confirmation of a bearish break.
The break beneath the rising wedge support and neckline suggests increased downside risk in the near term.
🧭 Technical Levels to Watch
Key Level Type Action
633.00 Resistance (Head) Likely capped unless strong reversal
631.00 Resistance Right shoulder, overhead rejection
628.75 Neckline Support (Broken) Bearish trigger zone
628.20 Intraday support Final support test (now resistance)
625.50 Initial Target Breakdown projection
622.75 Lower Support Measured move target zone
📌 Measured Move Projection:
A break of ~4.5 points from head to neckline projects a target near 624–625 in the near term.
📊 Volume Profile Note
Volume expanded on the neckline break, supporting the validity of the pattern.
Recent bars show a rise in selling pressure as bulls failed to reclaim above 630 after the breakdown.
🔍 Summary Outlook
Bearish Bias: Valid while below 628.75 neckline resistance.
Invalidation Zone: A sustained close above 631.00 would invalidate the bearish pattern.
Watch for Retest: Any bounce into 628.75–629.25 could act as a retest and fade opportunity.
📆 Next Steps:
Short-term traders should monitor price action around 625.50 and 622.75 as the most likely zones for support. Watch for further confirmation with broader index weakness or macro catalysts.
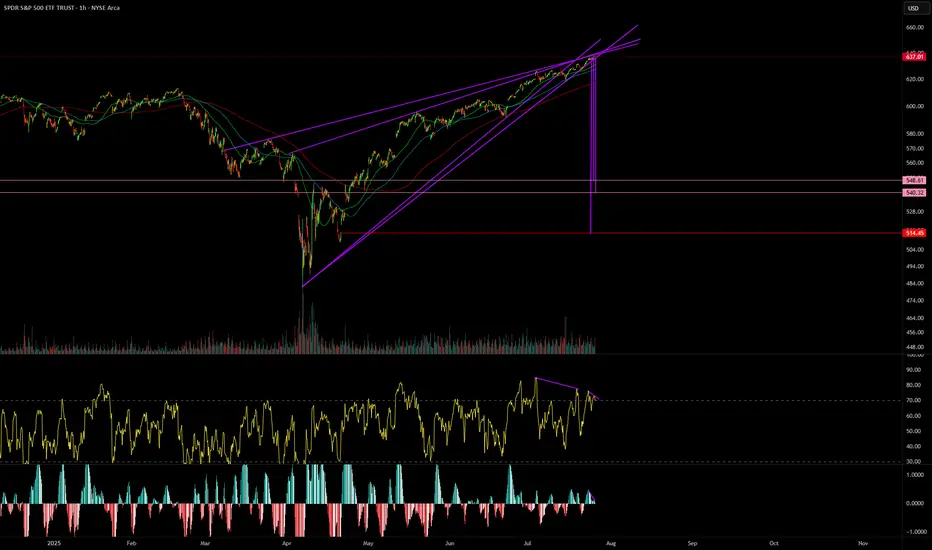
SPY Imagine the SmellImagine the smell from the Bulls if the $514 gap is filled.
Bearish divergence galore.
Not a matter of if this wedge breaks.
Its when.
SPY 15-Min — Weak-High Sweep in Play• Discount BOS at 603.95 → impulsive leg to 606.7 (0.886)
• Weak high tagged at 607.16 – expecting continuation to 1.382 ≈ 608.61 then 1.854 ≈ 610.92
• Invalidation if price closes below 605.45 session VWAP band
• Targets: 608.61 → 610.92
• Risk: stop 604.9 (below 0.5 Fib)
VolanX bias remains risk-on while micro structure stair-steps above the 9-EMA channel.
Educational only – not financial advice
#SPY #SMP500 #OrderFlow #Fib #VolanX #WaverVanir

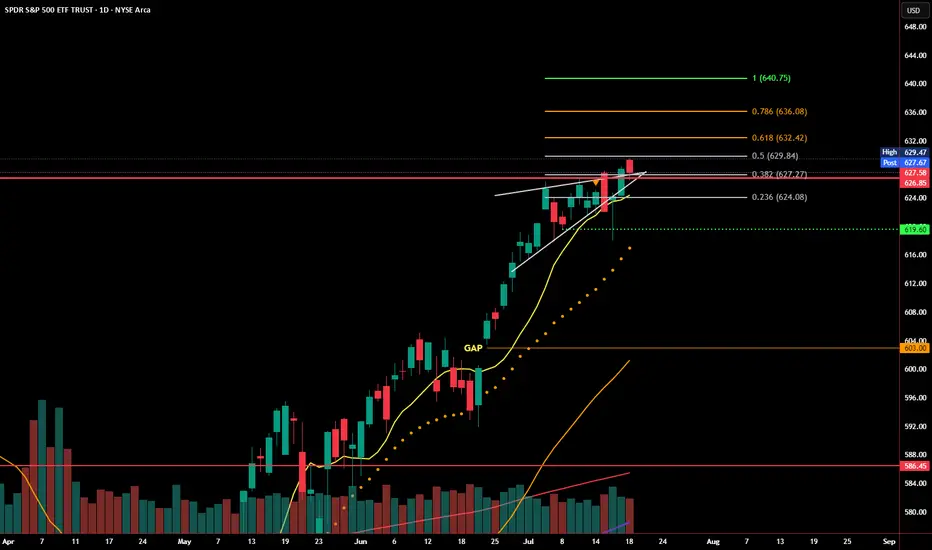
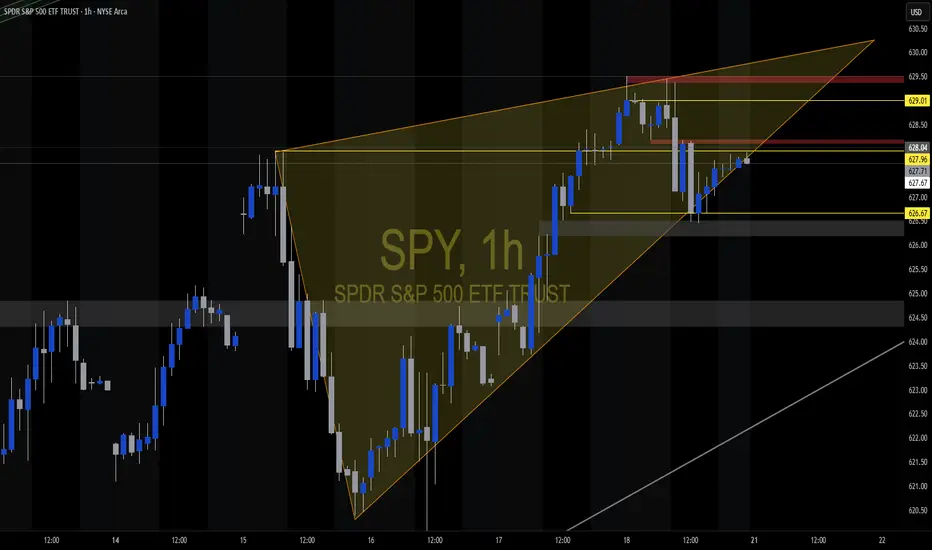
SPY Reclaims Rising Wedge Support - Bear Trap or Breakout Setup?SPY dropped below its rising wedge earlier this week, but that move may have been a bear trap. Price quickly reversed, reclaiming the wedge trendline and closing just below a key Fibonacci level at 629.84.
Buyers stepped in aggressively near the 0.382 and 0.236 retracement zones, defending short-term support. The bounce came on increased volume, signaling strength behind the recovery. Momentum remains intact as long as SPY holds above 626.
Now, bulls need to confirm with a breakout above 629.84–631.96 to open the door to the next levels at 635.63 and 640.30. Failure to break through could lead to another rejection and revisit lower support zones.
Levels to watch:
Support: 626.64, 623.62, 619.60
Resistance: 629.84, 631.96, 635.63
SPY is at a decision point. Reclaiming wedge support is a bullish signal, but bulls need follow-through to avoid another fakeout in the opposite direction.
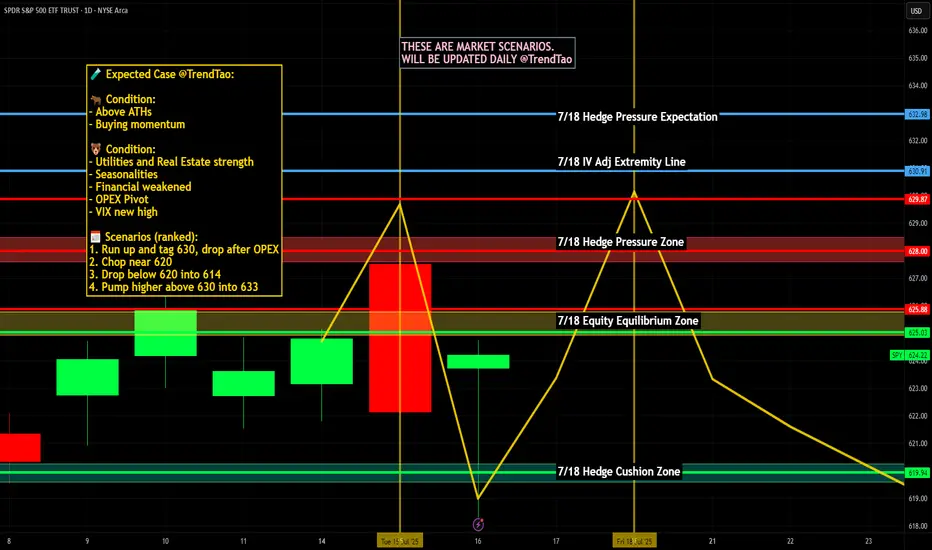
Earnings Heat Up - 6300 and 6200 SPX Key Levels RemainMarket Update
SPX Key Levels
-SPX poked 6300 Tuesday, Thursday, and poked higher Friday (but settled back to 6300)
-6200 support remains a key level
-6050/6000/5800 next floor levels, I'll be looking for dips
I can see the market slowly (and I mean SLOWLY) grinding higher but preparing for a
reasonable seasonal selloff through end of July into end of September window
July 28-August 1 is a monster week in the markets
-Megacap Earnings (MAG7 Tue/Wed/Thu)
-Wed July 30 - FOMC (Pause expected but Powell's Press Conference is important)
-Friday August 1 - Non-Farm Payroll, Tariff Deadline
I'm hitting fresh YTD highs so I'm not complaining about this melt-up and grind, I'm simply wanting to allocate positions and add to my positions at better levels and with a slightly
higher VIX to help take advantage of the expected move being greater than the actual move
Have a great weekend and thank you watching!!!

SPY risk on for a few weekslooks like we are still moving up (SPX 6,400-6,500) but the risk to a correction is increasing.
FOMO phase on meme stock. so still profit to be had

Elliott Wave Analysis: SPY Poised To Extend Higher In Bullish SeElliott Wave sequence in SPY (S&P 500 ETF) suggest bullish sequence in progress started from 4.07.2025 low. It expects two or few more highs to extend the impulse sequence from April-2025, while dips remain above 6.23.2025 low. SPY ended the daily corrective pullback in 3 swings at 480 low on 4.07.2025 low from February-2025 peak. Above there, it favors upside in bullish impulse sequence as broke above February-2025 high. Currently, it favors wave 3 of (1) & expect one more push higher from 7.16.2025 low in to 630.31 – 651.1 area before correcting in wave 4. In 4-hour, it placed 1 at 596.05 high, 2 at 573.26 low as shallow connector & extend higher in 3. Within 3, it placed ((i)) at 606.40 high, ((ii)) at 591.89 low, ((iii)) at 627.97 high & ((iv)) at 618.05 low.
In 1-hour above ((ii)) low of 591.89 low, it ended (i) at 605.96 high, (ii) at 603.17 low, (iii) at 626.87 high as extended move, (iv) at 620 low & (v) as ((iii)) at 627.97 high. Wave ((iv)) ended in 3 swing pullback as shallow connector slightly below 0.236 Fibonacci retracement of ((iii)). Within ((iii)), it ended (a) at 619.8 low, (b) at 624.12 high & (c) at 618.05 low on 7.16.2025 low (this week). Above there, it favors rally in ((v)) of 3 targeting in to 630.31 – 651.1 area before correcting in 4. Within ((v)), it placed (i) at 624.73 high, (ii) at 623.08 low & favors upside in (iii) of ((v)). We like to buy the pullback in clear 3, 7 or 11 swings correction at extreme area in 4 and later in (2) pullback, once finished (1) in 5 swings.

Climbed too fast to the top of the channel?Weekly chart on log - looks like its already topped out and will likely hit one of those targets in the coming weeks. Maybe a test or slight break above channel before going down.

Nightly $SPY / $SPX Scenarios for July 17, 2025🔮 Nightly AMEX:SPY / SP:SPX Scenarios for July 17, 2025 🔮
🌍 Market-Moving News 🌍
🇮🇳 India–U.S. Inflation Divergence Dampens Dollar
India’s June retail inflation tumbled to a six-year low, while U.S. CPI hit its fastest pace since February—driven by tariff effects. This divergence is weakening the U.S. dollar against the rupee, pushing down dollar‑rupee forward premiums
📜 Treasury to Ramp Up T-Bill Issuance
Following the recent debt-ceiling increase, the U.S. Treasury plans to issue over $1 trillion in T-bills over the next 18 months. Money-market funds, flush with cash, are expected to absorb the supply, which could influence short-dated yields
💱 Dollar Eases Amid Fed-Related Volatility
Headline news that President Trump “highly unlikely” to fire Fed Chair Powell, coupled with stable PPI data, calmed markets. The dollar dipped slightly after earlier turmoil, while gold and bonds saw modest gains
📊 Key Data Releases & Events 📊
📅 Thursday, July 17:
(No major U.S. economic releases)
Markets will track T-bill issuance plans, dollar forward dynamics, and statements from the Treasury and Fed regarding debt and rate strategy.
⚠️ Disclaimer:
This is for educational purposes only—not financial advice. Consult a licensed financial advisor before making investment decisions.
📌 #trading #stockmarket #economy #dollar #tbills #inflation #Fed #technicalanalysis
SPY PRICE ACTION 16 JULY 2025This is the price action of spy at its very best as always. I have clearly discussed the important levels & have also discussed the momentum as well.
Feel free to leave your comment
NOTE:I AM NOT TRADING SPY

SPY (SP-500) - Rising WedgeYesterday we had a breakdown of the rising wedge on SPY. I draw out some important levels to look out for coming days/weeks. The trendline since april has also been broken. ICEUS:DXY is breaking out to which is increasing the risks for a "Risk off" scenario in tech stocks and crypto.
Nothing here should be interpreted as financial advise. Always do your own research and decisions.

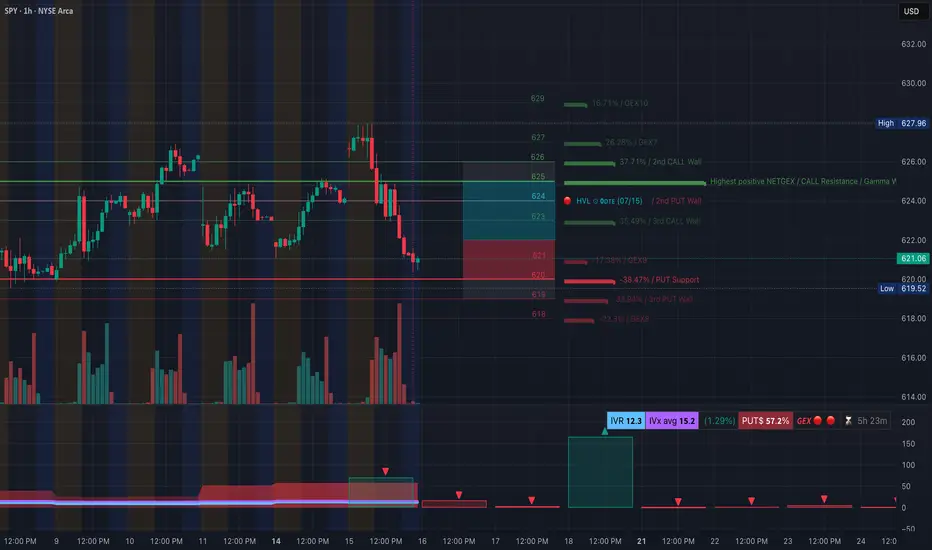
SPY at Key Support! Will It Hold or Break? TA for July 16🧨 GEX-Based Options Outlook:
* GEX Sentiment: Negative gamma dominates (🟥 GEX 🔻), indicating elevated dealer hedging risk.
* Put Wall & Support:
* Major PUT Wall at 620 (⚠️ -38.47%) is being tested.
* Additional downside liquidity lies below 618.
* Call Resistance:
* Upside resistance around 625–627, where both the 2nd CALL Wall and GEX7/8 sit.
* IV/Flow Summary:
* IVR 12.3 (low), PUTs 57.2% – bearish skew.
* Option flow is protecting downside → less confidence in upside follow-through unless we reclaim 624.5+.
* Conclusion: SPY is pinned around major support. A breakdown under 620 could accelerate downside into 616/614 range.
📉 1H Price Action & Trade Setup:
* SPY formed a CHoCH breakdown and is retesting the wedge base.
* Strong rejection from the 624.81–627.96 supply zone.
* Price is now hugging trendline support and could trigger a bounce or further breakdown depending on liquidity sweep.
Bullish Scenario:
* ✅ Entry: Above 621.50 reclaim with confirmation.
* 🎯 Targets: 624.50 → 626.80.
* ⛔ Stop: 620 or below trendline.
* ⚠️ Note: Only valid if SPY holds the CHoCH base and sweeps under 620 to trap bears.
Bearish Scenario:
* ❌ Entry: Clean break below 620, especially if it fails a retest.
* 🎯 Targets: 618 → 615.50 → 612.
* ⛔ Stop: Back above 622 with volume.
🎯 My Thoughts & Recommendation:
SPY is balancing on a major PUT wall and SMC support trendline. If 620 fails, the path of least resistance is down toward 615 and potentially 612 due to the lack of supportive gamma levels below. A relief bounce is possible only if dealers regain control above 624. Keep stops tight, as this zone could snap quickly.
This analysis is for educational purposes only and does not constitute financial advice. Always do your own research and manage your risk before trading.
Nightly $SPY / $SPX Scenarios for July 22, 2025🔮 Nightly AMEX:SPY / SP:SPX Scenarios for July 22, 2025 🔮
🌍 Market-Moving News 🌍
🚀 Tech & EV Stocks in Focus Ahead of Earnings
Futures were quiet ahead of Tuesday’s open, but key movers included Astera Labs (+19%), Alphabet (+2.7%), Netflix +2%, and Robinhood –4.9% after being passed over for the S&P 500. Investors are positioning ahead of major tech and EV earnings this week — including Tesla, Alphabet, Lockheed Martin, Coca‑Cola, and Honeywell
📣 Powell Speech Eyed for Rate Clues
Fed Chair Jerome Powell is set to speak at 8:30 AM ET today at the Integrated Review of the Capital Framework for Large Banks Conference in D.C. Markets will be watching for any indications on future interest rate direction
🌏 Japan’s Political Shift Has Little Market Impact
Japan’s ruling coalition lost its upper-house majority over the weekend, but markets remained stable as it was largely expected. The yen held steady, and Asian equities stayed calm amid the holiday—focus remains on upcoming corporate earnings
📊 Key Data Releases & Events 📊
📅 Tuesday, July 22:
8:30 AM ET – Powell Speech: Key address at the bank regulation conference. Tone and forward guidance may sway bond and equity markets.
After Market Close – Alphabet & Tesla Earnings: Heavyweights due today—market attention will track revenue guidance, especially on advertising, EV demand, and AI.
⚠️ Disclaimer:
For educational and informational purposes only. Not financial advice—consult a licensed advisor before making investment decisions.
📌 #trading #stockmarket #tech #Fed #earnings #AI #infrastructure #volatility
SPY/QQQ Plan Your Trade Special Update : BUCKLE UPThis video is a special update for all TradingView members. I felt I needed to share this information and present the case that I believe poses the most significant risk to your financial future - and it's happening right now.
Several weeks ago, I identified a very unique mirror setup in the SPY and kept an eye on how it was playing out. I needed to see confirmation of this setup before I could say it had any real likelihood of playing out as I expected.
As of today, I'm suggesting that we now have excellent confirmation that the US/Global markets are about to enter a deep consolidation phase, lasting through the rest of 2025 and possibly into 2026 and early 2027.
The interesting thing about this price pattern/structure is that it is almost exactly the same as the 2003-2007 structure, which I believe is the origin of this mirror setup. Almost down to the exact type of price bars/patterns I'm seeing.
Many of you are already aware that I've been calling for a critical low cycle in the SPY on July 18 for many months. What you may not realize is that the pattern is based on Weekly price data. The July 18 cycle low can have a span of +/- 1-3 weeks related to when and how the cycle low pattern plays out.
Watch this video. If you have any questions, message me or comment.
I'm still here, doing my best to identify and unlock the secrets of price action and to help as many traders as I can.
Price is the Ultimate Indicator.
Get some.
#trading #research #investing #tradingalgos #tradingsignals #cycles #fibonacci #elliotwave #modelingsystems #stocks #bitcoin #btcusd #cryptos #spy #gold #nq #investing #trading #spytrading #spymarket #tradingmarket #stockmarket #silver

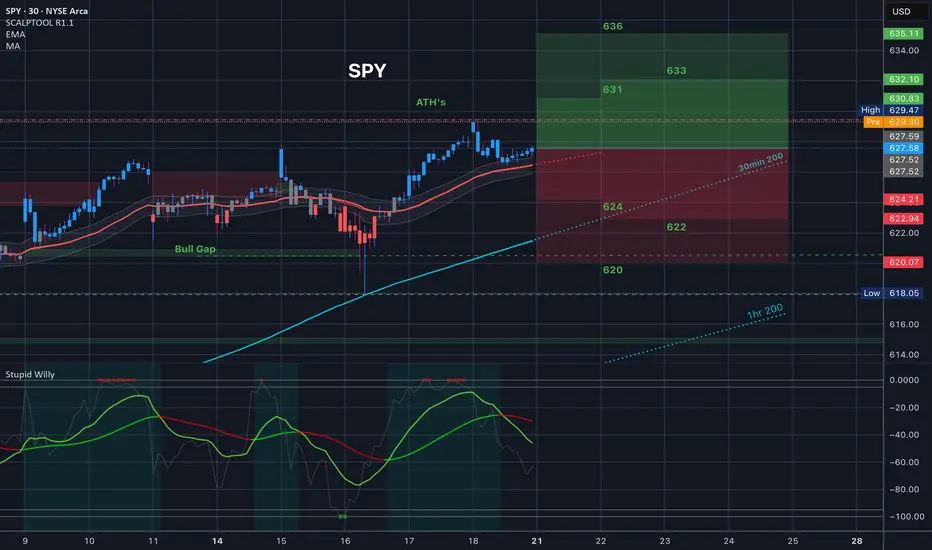
SPY July 21-25AMEX:SPY
Looking at the 4 hr. timeframe on SPY. Bearish divergence is signaling a need for some cool off. I assume this will happen almost immediately, Monday maybe into Tuesday. I expect to keep above strong support levels at 618 and 609.95. Drops below 609 will change my stance to a more bearish tone. assuming we hold these levels, I expect that SPY will continue upward after some small consolidation up here in the range. Looking at a trend-based fib, some price points to the upside above ath's(all time highs) would be 633.52 and 637.85. Even 654.
Economic and policy fundamentals could shift any bullishness into another sharp pullback or even up into higher price targets.
Not much to be bearish abut this week, earnings season is kicking off and this could play a role as well; Tesla and google & blue chips happening Tuesday- Thursday.
These earnings could be the mystery seasoning to shake up this week's movement.
Potential Reversal - signs to look forSPY likely reaches 615 this week, if it gets under it will be a change of character. Gold still choppy, nothing decided just yet. Oil also undecided. Nat Gas may pullback from it's breakout. BTC looks like it may have at least a good pullback.

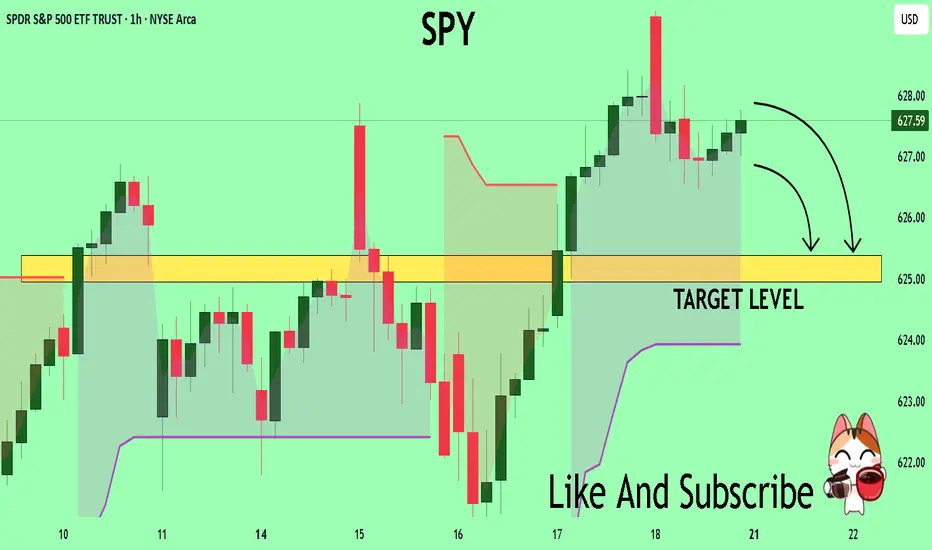
SPY What Next? SELL!
My dear friends,
Please, find my technical outlook for SPY below:
The instrument tests an important psychological level 627.59
Bias - Bearish
Technical Indicators: Supper Trend gives a precise Bearish signal, while Pivot Point HL predicts price changes and potential reversals in the market.
Target - 625.38
About Used Indicators:
Super-trend indicator is more useful in trending markets where there are clear uptrends and downtrends in price.
Disclosure: I am part of Trade Nation's Influencer program and receive a monthly fee for using their TradingView charts in my analysis.
———————————
WISH YOU ALL LUCK
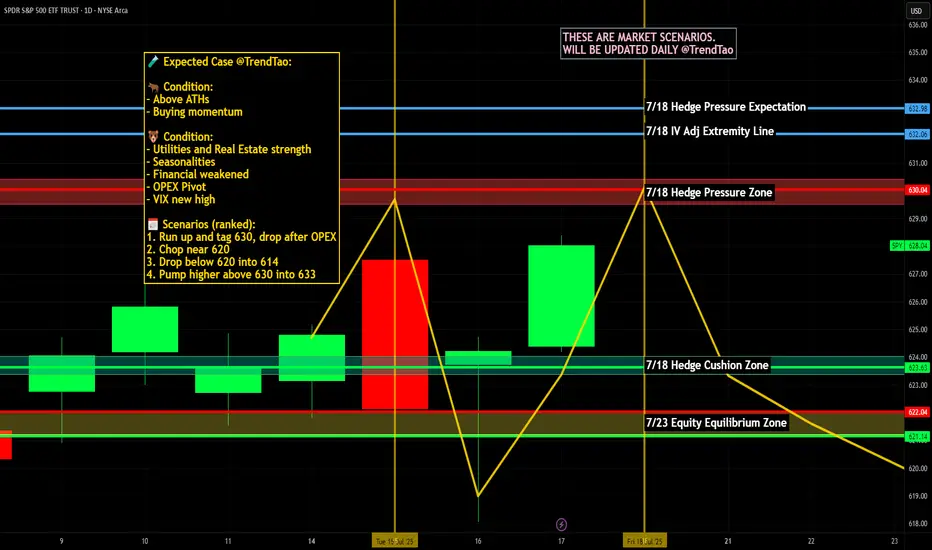
$SPY Trading Range for 7.21.25 and everything in itToday’s Trading range and everything in it. How are you playing it?
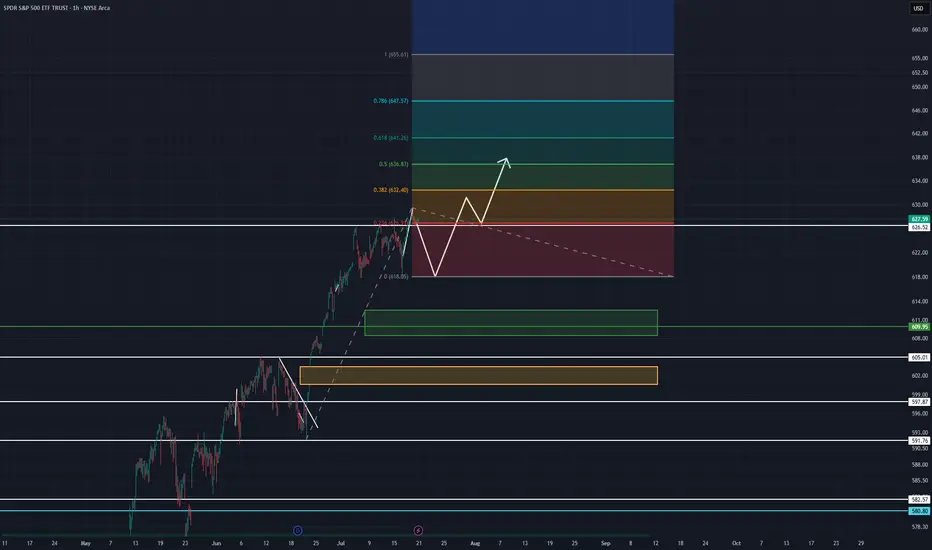
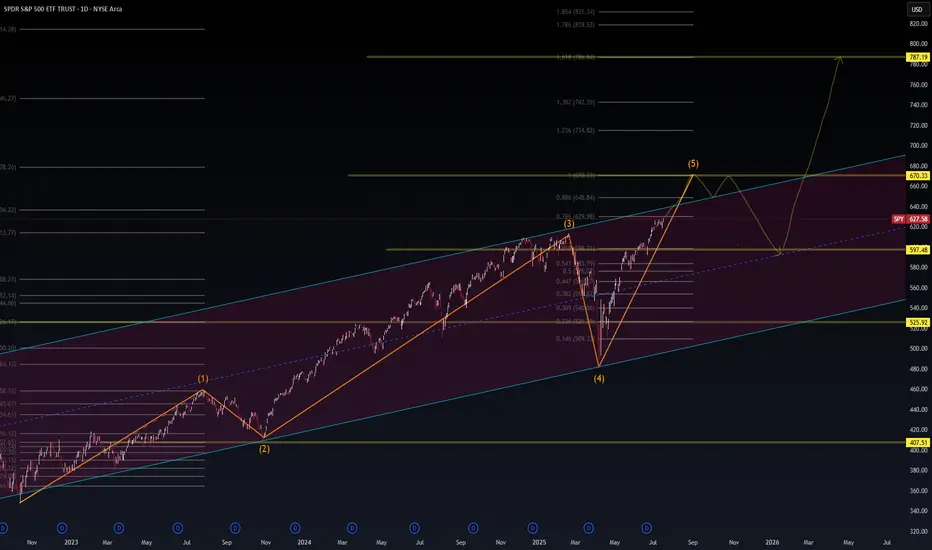
SPY Macro Wave Outlook – Bullish Fifth Wave into AI Supercy📈 SPY Macro Wave Outlook – Bullish Fifth Wave into AI Supercycle?
🧠 WaverVanir DSS | VolanX Protocol | Institutional AI Alignment
The SPY rally appears to be unfolding within a 5-wave macro impulse, currently inside Wave (5) targeting the 670–787 zone, depending on macro alignment and Fed behavior. This structure converges with long-term Fibonacci clusters and macro transition signals.
🔍 Thesis:
Wave (5) in Progress – Next resistance seen at ~670.33, followed by long-term targets near 787.19.
Pullback Scenario – A temporary correction into the 597–600 range is possible before further upside.
Structure Validity – Channel and Fibonacci extensions confirm bullish continuation unless macro conditions deteriorate sharply.
🧠 Macro Alignment Required:
Fed Pivot Late 2025 → Probability: 60%
Earnings Growth Led by AI → 11% projected for S&P500 (GS)
Productivity > Consumption → AI-led industries showing 5%+ labor productivity growth (Dallas Fed)
Low Inflation Reacceleration Risk → Core PCE stabilization key
⚠️ Risk Matrix:
Macro Risk Probability Notes
Fed Hawkish Reversal 30% Data-dependent but unlikely unless inflation re-flares
AI Concentration Shock 25% Tech-heavy rally, breadth remains a concern
Valuation Compression 20% Shiller CAPE near 37
Trade War Reignition 15% Tariff risk remains a geopolitical tail
🎯 Target Zones:
Near-term: 670.33 (Wave 5 peak)
Medium-term: 714–787 (Fib clusters)
Correction Zone: 597–600, invalidation below 525
The AI economy is accelerating—productivity is now outpacing consumption in several sectors. This macro regime shift could be the foundation for the next secular bull wave.
🔺 Powered by VolanX Protocol
⚠️ Not financial advice. Educational chart generated by institutional DSS models.
#SPY #VolanX #WaverVanir #ElliottWave #MacroTrading #AIProductivity #Fibonacci #FedPivot #USEquities #TradingSignals #SmartMoneyConcepts #InstitutionalStrategy #AIInvesting #SP500
Nightly $SPY / $SPX Scenarios for July 19, 2025🔮 Nightly AMEX:SPY / SP:SPX Scenarios for July 19, 2025 🔮
🌍 Market-Moving News 🌍
🏢 U.S. Corp Buybacks Set to Propel Stocks
Citadel Securities expects U.S. companies to repurchase roughly $1 trillion of stock in 2025. With the blackout period ending in August, buybacks—historically strong in July, the stock market’s best month—could bolster valuations
⚖️ Fed Independence Debate Intensifies
President Trump’s continued criticism of Chair Powell has already weakened confidence in Federal Reserve autonomy. The fallout shows up in a weaker dollar, elevated Treasury yields, and rising inflation expectations—though stocks have remained resilient
🇺🇸 Immigration Rollback Sparks Economic Concern
The rescinding of Temporary Protected Status for ~900,000 immigrants could remove up to 1.1 million workers from the labor force. Analysts warn of potential stagflation risks, with GDP growth potentially down 0.3–0.4 percentage points and labor-market tightening ahead
💵 Massive T-Bill Issuance Incoming
Following the debt-ceiling deal, the Treasury plans over $1 trillion in T-bill issuance in the next 18 months. Money-market funds are expected to absorb much of it, influencing short-term rates and cash-market dynamics
📊 Key Data Releases & Events 📊
📅 Friday, July 19:
8:30 AM ET – Initial Jobless Claims
Weekly figure on new unemployment filings—a real-time indicator of labor-market resilience.
8:30 AM ET – Existing Home Sales (June)
Measures signed contracts on previously owned homes; key for gauging housing-market health.
All Day Events:
Ongoing corporate buybacks entering open window
Treasury auctions and T-bill issuance updates
⚠️ Disclaimer:
This information is for educational and informational purposes only and should not be construed as financial advice. Always consult a licensed financial advisor before making investment decisions.
📌 #trading #stockmarket #economy #monetarypolicy #debt #housing #labor #technicalanalysis
Double Bull Flags on an Ascending Triangle breakout on the dailyDaily, double Bull Flag, on top of an Ascending Triangle Breakout. Golden Pocket on the Fib Ext is $588 🥂
