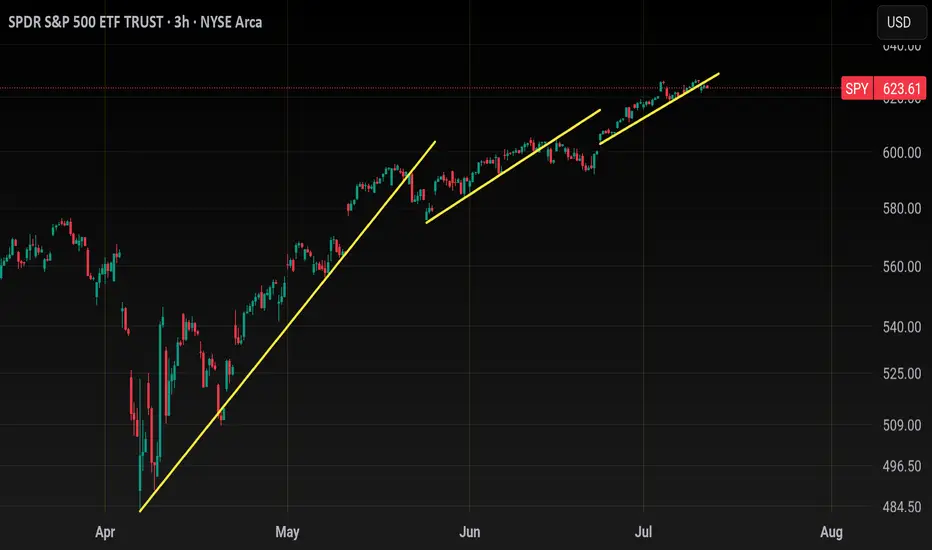
Market Outlook: Bulls are still in control, but be defensive.At theses levels don't let your guard down. I could see us pulling back next week, meanwhile we may continue to stay above the 10-EMA for now.
SPY trade ideas

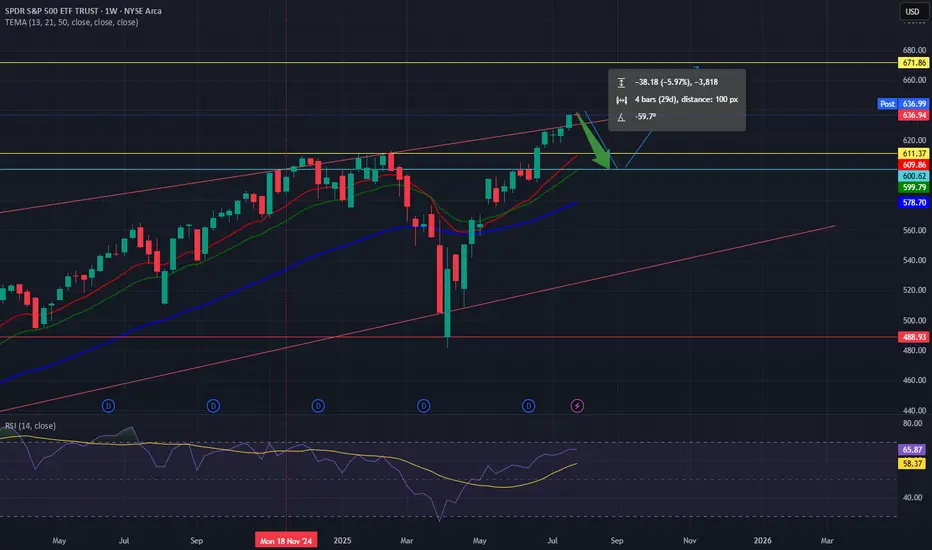
SPY Weekly Chart: Rising Wedge Signals Imminent PullbackSPY Weekly Chart Overview (Current Price: ~637)
🧭 Context:
Indicators: TEMA (13/21/50) & RSI (14)
Price is extended, RSI near overbought (65.87), and forming a rising wedge — a bearish pattern.
🔻 Bearish Setup: Rising wedge signals possible reversal.
Momentum weakening despite higher highs.
Price extended above TEMA — a 600–610 pullback looks likely.
📊 Key Levels:Resistance: 672
Support: 611–600 → 578 → 488
Break below 600 could trigger broad downside.
🟢 Bullish Case:
Breakout above 672 with volume = momentum continuation (AI/FOMO driven).
🎯 Conclusion:
SPY is technically stretched. Risk/reward favors caution.
Watch for pullback to 600–610
Trading as a Probabilistic ProcessTrading as a Probabilistic Process
As mentioned in the previous post , involvement in the market occurs for a wide range of reasons, which creates structural disorder. As a result, trading must be approached with the understanding that outcomes are variable. While a setup may reach a predefined target, it may also result in partial continuation, overextension, no follow-through, or immediate reversal. We trade based on known variables and informed expectations, but the outcome may still fall outside them.
Therefore each individual trade should be viewed as a random outcome. A valid setup could lose; an invalid one could win. It is possible to follow every rule and still take a loss. It is equally possible to break all rules and still see profits. These inconsistencies can cluster into streaks, several wins or losses in a row, without indicating anything about the applied system.
To navigate this, traders should think in terms of sample size. A single trade provides limited insight, relevant information only emerges over a sequence of outcomes. Probabilistic trading means acting on repeatable conditions that show positive expectancy over time, while accepting that the result of any individual trade is unknowable.
Expected Value
Expected value is a formula to measure the long-term performance of a trading system. It represents the average outcome per trade over time, factoring in both wins and losses:
Expected Value = (Win Rate × Average Win) – (Loss Rate × Average Loss)
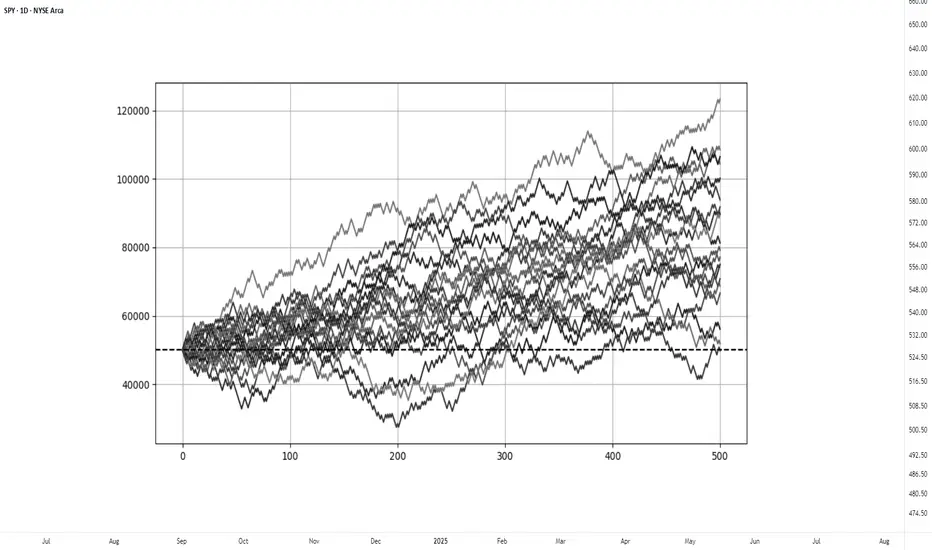
This principle can be demonstrated through simulation. A basic system with a 50% win rate and a 1.1 to 1 reward-to-risk ratio was tested over 500 trades across 20 independent runs. Each run began with a $50,000 account and applied a fixed risk of $1000 per trade. The setup, rules, and parameters remained identical throughout; the only difference was the random sequence in which wins and losses occurred.
While most runs clustered around a profitable outcome consistent with the positive expected value, several outliers demonstrated the impact of sequencing. When 250 trades had been done, one account was up more than 60% while another was down nearly 40%. In one run, the account more than doubled by the end of the 500 trades. In another, it failed to generate any meaningful profit across the entire sequence. These differences occurred not because of flaws in the system, but because of randomness in the order of outcomes.
These are known as Monte Carlo simulations, a method used to estimate possible outcomes of a system by repeatedly running it through randomized sequences. The technique is applied in many fields to model uncertainty and variation. In trading, it can be used to observe how a strategy performs across different sequences of wins and losses, helping to understand the range of outcomes that may result from probability.
Trading System Variations
Two different strategies can produce the same expected value, even if they operate on different terms. This is not a theoretical point, but a practical one that influences what kind of outcomes can be expected.
For example, System A operates with a high win rate and a lower reward-to-risk ratio. It wins 70% of the time with a 0.5 R, while System B takes the opposite approach and wins 30% of the time with a 2.5 R. If the applied risk is $1,000, the following results appear:
System A = (0.70 × 500) − (0.30 × 1,000) = 350 − 300 = $50
System B = (0.30 × 2,500) − (0.70 × 1,000) = 750 − 700 = $50
Both systems average a profit of $50 per trade, yet they are very different to trade and experience. Both are valid approaches if applied consistently. What matters is not the math alone, but whether the method can be executed consistently across the full range of outcomes.
Let’s look a bit closer into the simulations and practical implications.
The simulation above shows the higher winrate, lower reward system with an initial $100,000 balance, which made 50 independent runs of 1000 trades each. It produced an average final balance of $134,225. In terms of variance, the lowest final balance reached $99,500 while the best performer $164,000. Drawdowns remained modest, with an average of 7.67%, and only 5% of the runs ended below the initial $100,000 balance. This approach delivers more frequent rewards and a smoother equity curve, but requires strict control in terms of loss size.
The simulation above shows the lower winrate, higher reward system with an initial $100,000 balance, which made 50 independent runs of 1000 trades each. It produced an average final balance of $132,175. The variance was wider, where some run ended near $86,500 and another moved past $175,000. The drawdowns were deeper and more volatile, with an average of 21%, with the worst at 45%. This approach encounters more frequent losses but has infrequent winners that provide the performance required. This approach requires patience and mental resilience to handle frequent losses.
Practical Implications and Risk
While these simulations are static and simplified compared to real-world trading, the principle remains applicable. These results reinforce the idea that trading outcomes must be viewed probabilistically. A reasonable system can produce a wide range of results in the short term. Without sufficient sample size and risk control, even a valid approach may fail to perform. The purpose is not to predict the outcome of one trade, but to manage risk in a way that allows the account to endure variance and let statistical edge develop over time.
This randomness cannot be eliminated, but the impact can be controlled from position sizing. In case the size is too large, even a profitable system can be wiped out during an unfavorable sequence. This consideration is critical to survive long enough for the edge to express itself.
This is also the reason to remain detached from individual trades. When a trade is invalidated or risk has been exceeded, it should be treated as complete. Each outcome is part of a larger sample. Performance can only be evaluated through cumulative data, not individual trades.
SPY: Aiming 626 today Slowly./ Let's observe what this market will give us. If there is a setup, we take the trade.

[$SPY] S&P500: The Big mini Short or Why hedging is not a crimeAMEX:SPY CBOE:XSP
No financial advice.
For Entertainment purpose only.
Have you ever considered to protect yourself and wake up from the 'Long-Only-Delirium'?
Now is the time.. do you hear the cracking in the bond-market?
Rate cutting will solve it?
No reason to panic?
Doomsday i*diot?
We will see... 😈 tic tac tic tac
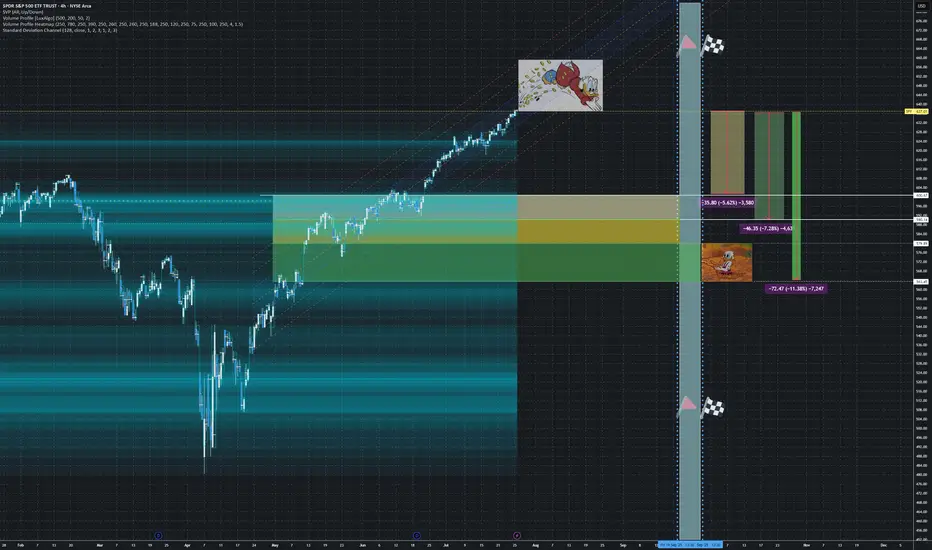
This time THETA is against us, but GAMMA is bleeding.
📊 Strategy Characteristics
+++Note: We set this one as a 'Diagonal Ratio Put Spread'
> Diagonal: Because the options have different expiration dates (Sept 19 + Sept 30)
> Ratio: Because we are buying more puts than selling (4:2 ratio)
> Put Spread: Because both legs are puts with the same strike
"We are all at a wonderful ball where the champagne sparkles in every glass and soft laughter falls upon the summer air. We know, by the rules, that at some moment, the Black Horseman will come shattering through the great terrace doors, wreaking vengeance and scattering the survivors. Those who leave early are saved, but the ball is so splendid no one wants to leave while there is still time, so that everyone keeps asking, ‘What time is it? What time is it?’ But none of the clocks have any hands." ~George Goodman

[$SPY] S&P500: The Big mini Short or Why hedging is not a crimeAMEX:SPY
No financial advice.
For Entertainment purpose only.
Have you ever considered to protect yourself and wake up from the 'Long-Only-Delirium'?
Now is the time.. do you hear the cracking in the bond-market?
Rate cutting will solve it?
No reason to panic?
Doomsday i*diot?
We will see... 😈 tic tac tic tac
This time THETA is against us, but GAMMA is bleeding.
"We are all at a wonderful ball where the champagne sparkles in every glass and soft laughter falls upon the summer air. We know, by the rules, that at some moment, the Black Horseman will come shattering through the great terrace doors, wreaking vengeance and scattering the survivors. Those who leave early are saved, but the ball is so splendid no one wants to leave while there is still time, so that everyone keeps asking, ‘What time is it? What time is it?’ But none of the clocks have any hands." ~George Goodman
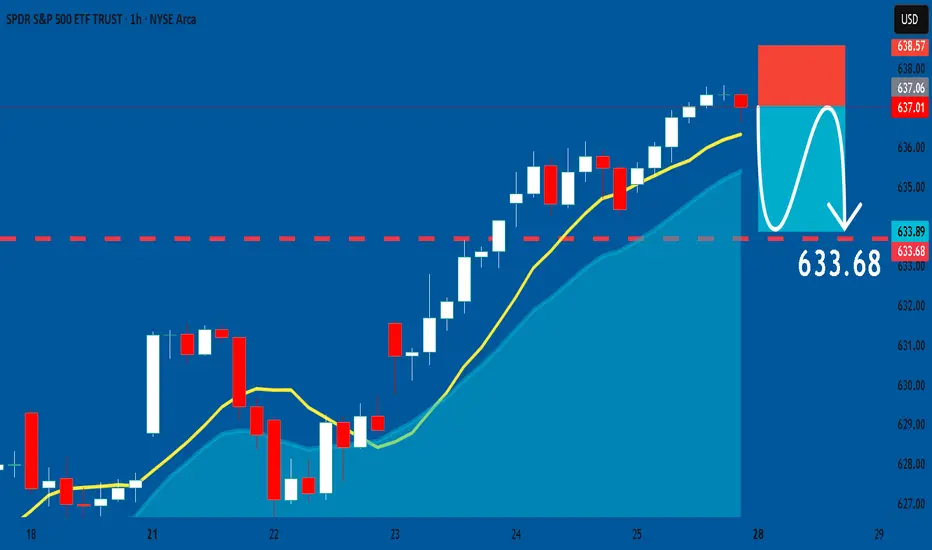
SPY: Bearish Continuation & Short Signal
SPY
- Classic bearish setup
- Our team expects bearish continuation
SUGGESTED TRADE:
Swing Trade
Short SPY
Entry Point - 637.01
Stop Loss - 638.57
Take Profit - 633.58
Our Risk - 1%
Start protection of your profits from lower levels
Disclosure: I am part of Trade Nation's Influencer program and receive a monthly fee for using their TradingView charts in my analysis.
❤️ Please, support our work with like & comment! ❤️
SPY Options Analysis Summary (2025-07-22)
🔻 AMEX:SPY Weak Bearish Put Setup (0DTE) – 07/22/25
All models agree: price is weak, momentum is limp, and VWAP is above.
But conviction? Not unanimous. High-risk, high-reward 0DTE scalpers only.
⸻
📉 Trade Setup
• 🟥 Direction: PUT
• 🎯 Strike: $626.00
• 💵 Entry: $0.57
• 💰 Target: $1.70 (+200%)
• 🛑 Stop: $0.28 (–50%)
• 📅 Expiry: Today (0DTE)
• ⚖️ Confidence: 65%
• ⏰ Entry Timing: Market Open
⸻
🧠 Multi-AI Consensus
Model Bias Action
Grok/xAI Weak Bearish ⚠️ No Trade
Claude Weak Bearish ⚠️ No Trade
Gemini Bearish ✅ $627 Put
Llama Moderately Bearish ⚠️ Conservative Put
DeepSeek Bearish ✅ $626 Put
🔹 VWAP < Price = Bearish bias
🔹 RSI = Neutral → watch for fakeouts
🔹 VIX favorable (<22)
🔹 Volume = weak = risk of whipsaw
⸻
⚠️ Risk Notes
• Bounce risk off session lows is real
• Lack of momentum may cause theta burn
• Best for scalpers who react fast — not a swing trade
• No conviction = smaller size, tighter leash
⸻
📢 Tagline (for virality):
“ AMEX:SPY is limping, not bleeding. But if it breaks, 200% comes fast. 0DTE scalpers: this is your window.” 💣

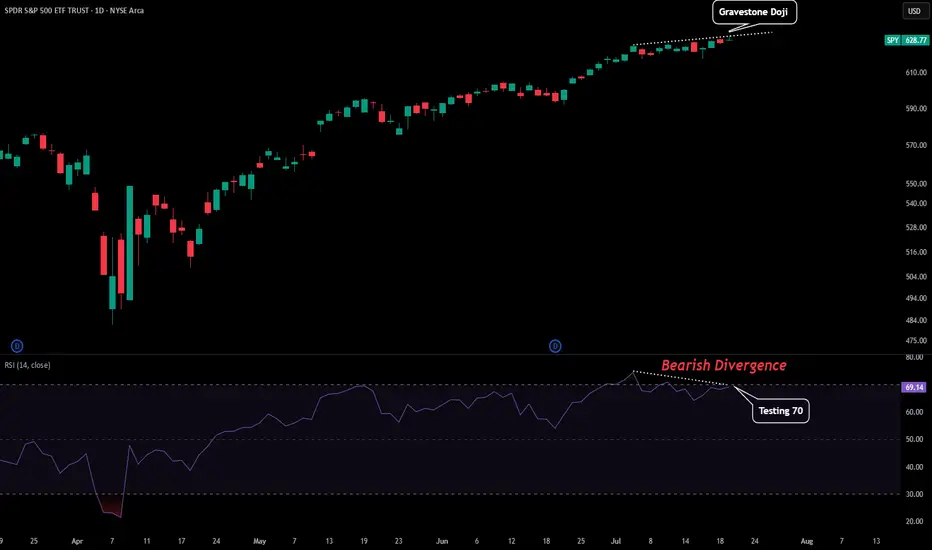
SPY - First Signs of TroubleFrom this entire uptrend we might be seeing the first signs of trouble.
Here are some reasons for this from a technical perspective:
-Daily Printed a Gravestone Doji
-RSI Testing Overbought as Resistance
-Slight Bearish Divergence on Daily RSI
-Momentum Stalling
There could also be some catalyst tomorrow that contribute to this. Powell speaks tomorrow so depending on what he says could either add fuel to a market reversal or negate these bearish signals and send us on another leg. Prepare for volatility.
SPY: Climbing the Wall of Worry — But Is a Turn Coming?SPY: Climbing the Wall of Worry — But Is a Turn Coming?
The S&P 500 (SPY) is pushing into a critical zone as we approach July 28th, and I can’t ignore the confluence of signals piling up here.
Technical Setup
We’re testing the top of a rising wedge formation.
Key round number overhead at $640 — a psychological and options magnet.
Price is extended well above moving averages with declining volume, often a warning sign for bulls.
Multiple resistance lines converge in this zone, creating a high-pressure point.
📆 Timing Matters
July 28 = weekly options expiry — with massive open interest clustered around $630–$640.
Seasonally, late July often marks a peak before August chop.
Add in some “tin foil hat” vibes: SPY’s riding momentum while major indices are diverging (looking at you, IWM), and the macro narrative feels shaky at best.
What Would Confirm a Reversal?
Breakdown below $625 with a high-volume red candle.
Bearish engulfing or shooting star candle near resistance.
VIX divergence or big money flowing into puts mid-week.
Key Levels
Resistance: $640 / $649.90
Support: $630 / $622 / $595
Reversal target (if confirmed): $594–$575 area
Final Thoughts
As we all know, markets can stay irrational longer than you can stay solvent. However, when trendlines, round numbers, timing, and seasonality align, I start watching for cracks. This may not be the top — but it might be the spark.
Following closely. Alerts set. Ready for the flush if it comes.

Weekly $SPY / $SPX Scenarios for July 21–25, 2025🔮 Weekly AMEX:SPY / SP:SPX Scenarios for July 21–25, 2025 🔮
🌍 Market-Moving News 🌍
🏦 Fed Chair Powell Speaks — Markets Key Into Tone
Federal Reserve Chair Jay Powell’s Jackson Hole speech is the week’s centerpiece. Markets will be closely listening for clues on inflation strategy, rate-cut timing, and sensitivity to geopolitical inflation drivers like tariffs.
📦 Tariff Deadlines Gain Spotlight
Multiple tariff deadlines are set this week for targeted trade partners including the EU, Mexico, Canada, Japan, South Korea, and Thailand. Any new announcements or extensions could trigger volatility in trade-exposed sectors.
🛢️ Oil Market Mixed Signals
Brent crude prices have stabilized near mid-$70s, but OPEC+ discussions regarding supply extensions and global growth concerns continue to inject uncertainty into energy-linked equities.
📈 Big Tech Earnings Kick Off
The “Magnificent Seven” tech giants begin reporting: Nvidia leads on Tuesday, followed by Microsoft, Amazon, Alphabet, and Meta later in the week. Expect significant sentiment swings based on forward commentary.
📊 Key Data Releases & Events 📊
📅 Monday, July 21
Quiet session ahead of a packed week of speeches and data.
📅 Tuesday, July 22
8:30 AM ET – Existing Home Sales (June):
Measures signed contracts on previously owned homes—a key housing indicator.
After Market Close – Nvidia Q2 Earnings:
Market will watch guidance and China commentary.
📅 Wednesday, July 23
8:30 AM ET – Leading Economic Indicators (June):
An early gauge of U.S. economic momentum.
📅 Thursday, July 24
8:30 AM ET – Initial & Continuing Jobless Claims:
Labor-market health indicator.
📅 Friday, July 25
8:30 AM ET – Durable Goods Orders (June):
Signals demand for long-lasting goods, often driven by business spending.
8:30 AM ET – New Home Sales (June):
Follows existing home data for housing sector insight.
4:00 PM ET – Fed Chair Powell Speech at Jackson Hole:
Expect commentary on inflation, growth, and rate-path clarity.
⚠️ Disclaimer:
This content is for educational and informational purposes only and should not be construed as financial advice. Consult a licensed financial advisor before making investment decisions.
📌 #trading #stockmarket #economy #Fed #earnings #housing #durablegoods #JacksonHole #technicalanalysis
hihiThe convergence of artificial intelligence and decentralized finance presents a paradigm shift in global economic systems, where algorithmic governance, autonomous agents, and smart contracts could redefine trust, efficiency, and access. This fusion offers transformative potential but raises critical ethical, regulatory, and socio-technical challenges demanding interdisciplinary exploration and resilient systemic safeguards.
Ask ChatGPT

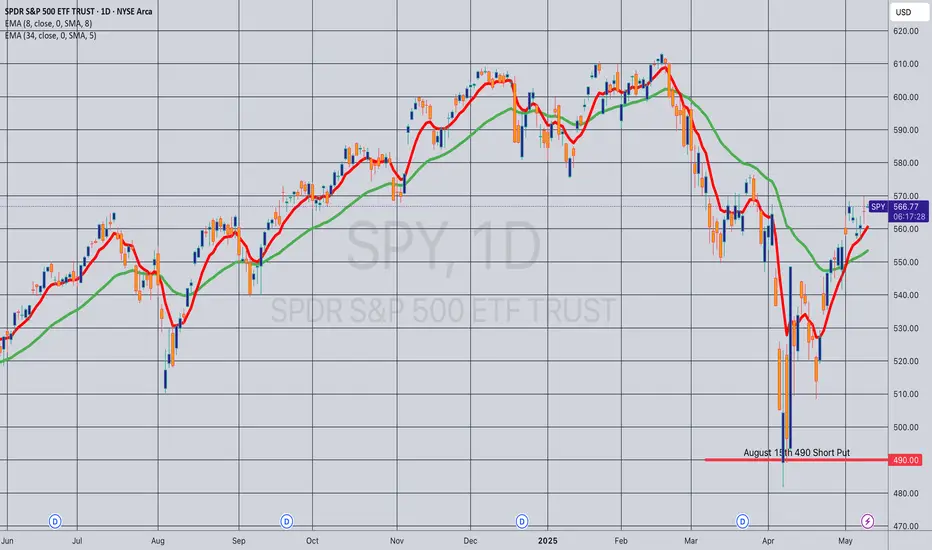
Opening (IRA): SPY August 15th 490 Short Put... for a 5.00 credit.
Comments: Laddering out, targeting the strike paying around 1% of the strike price in credit ... .
Will generally look to roll up to the shortest duration <16 delta strike paying 1% of the strike price if in profit.
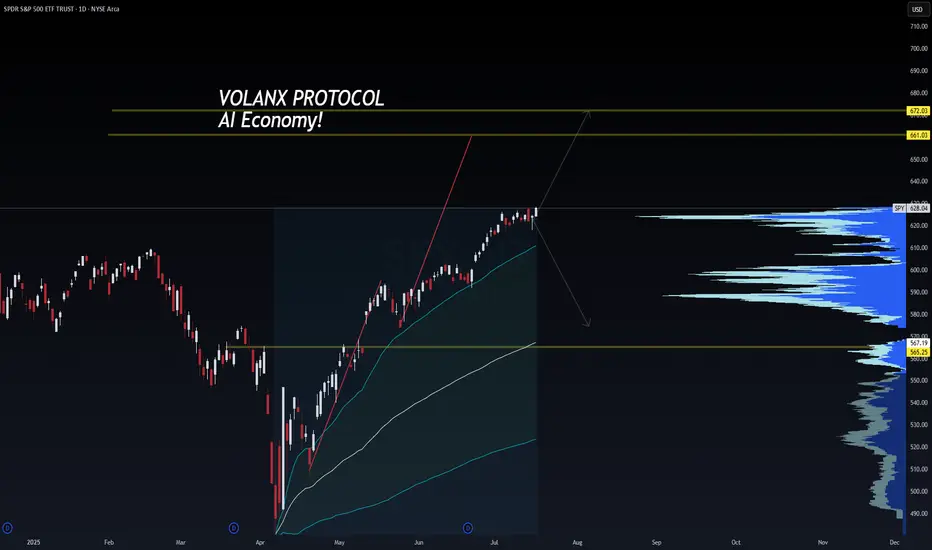
SPY 628 – Compression Before Expansion | VolanX Protocol Engaged🧠 SPY 628 – Compression Before Expansion | VolanX Protocol Engaged
📅 July 17, 2025
🔍 SPY (S&P 500 ETF Trust) | 1D Chart
📍 Current Price: 628.04
📈 Chart Thesis by: WaverVanir International LLC
🔗 Powered by VolanX Protocol
🌐 Macro Overview:
The market stands at a critical inflection point, with bulls and bears both pressing their narrative:
The Fed is expected to cut rates in September, with soft CPI and decelerating labor trends justifying a pivot.
Earnings season is bifurcated: Mega-cap tech is leading, while cyclicals are faltering. This raises the risk of a short-term rally masking deeper fragility.
Global macro risks – including rising geopolitical stress in the Asia-Pacific region and commodity volatility – increase the odds of a tail event.
📊 Technical Outlook:
SPY is now hugging a major supply zone near 628 with price stalling for multiple sessions. This area marks a compressed equilibrium where volatility is likely to expand soon. Key technicals:
Rejection candles suggest seller presence near 630.
Price is overextended but remains above all major EMAs.
Breakdown zone sits at 565, which aligns with prior resistance and a major volume shelf.
No current bearish divergence on RSI or MACD, but momentum is flat.
🎯 VolanX Probabilistic Bias:
The system currently anticipates three paths:
Bullish breakout toward 660–675 if the Fed confirms a dovish stance and tech continues to lead.
Neutral grind in the 600–615 zone if macro remains balanced and earnings don’t surprise.
Bearish breakdown to 565 or lower if macro stress emerges or dollar strength accelerates.
🛠️ Options Strategy Highlights:
Bullish Trade Idea: Buy 630C / Sell 660C (30–45 DTE) – Low cost, targets breakout above resistance.
Bearish Trade Idea: Buy 620P / Sell 565P – High R/R play into macro unwind.
Both are defined-risk strategies, ideal in volatile inflection zones like this.
⚠️ VolanX Note:
This is a classic binary event structure forming under institutional watch. DSS scans show compression is now mature. Whichever side confirms will likely trigger a large move, not a drift.
Let the narrative confirm the signal.
⚠️ This post is for informational and educational use only. Not financial advice.
#SPY #VolanX #MacroTrading #OptionsFlow #WaverVanir #FOMC #AIeconomy #LiquidityWave #TradingSignals
SPY is about to dumpThere isn't much to say. Chart speaks for itself. Possible shark farming if we hit resistance at this trendline that was resistance since 2022. Not shown but its also at the 707 extension of the October '24 and April '25 low.

$SPY Trading Range for 7.15.25 and everything in it for CPI
Tomorrow’s Trading range and everything in it. How are you playing it?

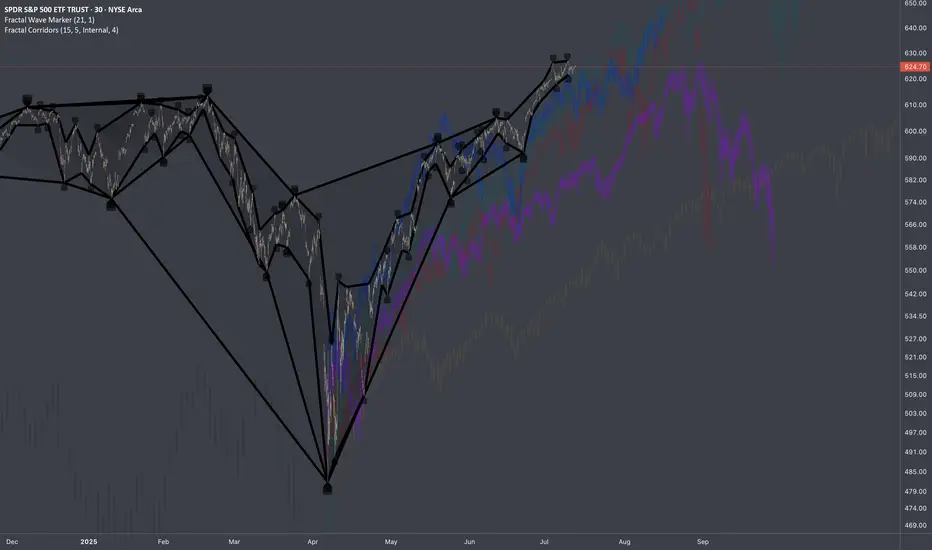
$SPY: Composite Sub-Cycles (Recursive)Research Notes Documenting Commonality
I’ve identified several bar patterns that formed following significant historical declines. They share notable similarities, as if suggesting that the magnitude of past major moves sets the structure of subsequent groups of sub-cycles (which I call "building blocks" sometimes).
I placed them in respect to current scaling laws so the method of exclusion can be applied in order to familiarize with typical "terrain" of price dynamics at such phase. Documenting them because a direct study is the most effective approach to uncovering the essence of recursive patterns.
Some of the bar patterns are lowered to highlight temporal aspect which matters more than price scale.
SPY Daily Chart – Rising Wedge at Resistance, RSI Near OverboughSPY continues to push higher, but today's candle reinforces a cautious tone as we approach a key inflection point.
The chart is currently forming a rising wedge pattern — historically a bearish structure that often precedes downside breaks, especially when forming after a strong upside move. Price is hugging the upper boundary of the wedge, with multiple failed breakout attempts near 626.87, which is acting as strong resistance.
The RSI sits at 68.59, just below the 70 overbought threshold. While this confirms strong bullish momentum, it also signals that the move may be getting stretched. A rejection here or a lower high on RSI while price continues higher could form a bearish divergence, a classic early reversal signal.
Volume remains moderate (~51.85M), and the candles have tightened — suggesting indecision. The rising wedge’s lower trendline and the short-term moving average (likely the 8 or 10 EMA) are immediate support. A break below these levels would shift the bias more clearly to the downside.
Key levels to watch:
Resistance: 626.87 (wedge top)
Support: rising wedge lower boundary and EMA (around 620–622)
RSI: break below 65 or a confirmed divergence would increase bearish risk
If the wedge breaks down with a drop in RSI and a flip in momentum indicators (such as Parabolic SAR), it may open the door for a pullback toward previous support zones near 603 or even 592.63.
No confirmation yet, but the risk-reward here starts to shift away from chasing longs. Caution is warranted.

Nightly $SPY / $SPX Scenarios for July 15, 2025🔮 Nightly AMEX:SPY / SP:SPX Scenarios for July 15, 2025 🔮
🌍 Market-Moving News 🌍
📦 Dow Futures Dip on New Tariff Announcements
President Trump announced new 30% tariffs on EU and Mexico, with additional duties on Japan, South Korea, Malaysia, Kazakhstan, South Africa, Laos, and Myanmar starting August 1. Dow, S&P, and Nasdaq futures each slipped ~0.3% as markets assess inflation risk ahead of key CPI data this week
📈 Tech & AI Stocks Lead Despite Tariffs
Stocks like Circle (+9.3%), CoreWeave (+5.2%), Palantir (+5%), Roblox (+5.8%), and Shopify (+4.1%) surged, showcasing sector resilience amid broader tariff fears
⚠️ Deutsche Bank Warns of Summer Volatility
With thin market liquidity and rising geopolitical tension (tariff deadline Aug 1), Deutsche Bank flags summer as a period prone to sudden corrections
📊 Key Data Releases & Events 📊
📅 Tuesday, July 15:
8:30 AM ET – CPI (June)
Core CPI is projected at +0.3% MoM (2.7% YoY) and headline CPI +0.3% MoM—signs tariff effects may be feeding into prices
8:30 AM ET – Core CPI (June)
Expected to come in around 3.0% YoY.
8:30 AM ET – Empire State Manufacturing Survey (July)
Forecast: –7.8 (less negative than June’s –16.0) — a modest sign of stabilizing factory conditions
Fed Speakers Throughout the Day
Watch for commentary from Fed officials (Michael Barr, Barkin, Collins, Logan) for fresh insights on inflation and monetary policy
⚠️ Market Interpretation:
Inflation Watch: A hotter-than-expected CPI could delay anticipated rate cuts and lift yields. A pick-up in core CPI above 3% would be a red flag.
Growth Signals: A less-negative Empire State reading may suggest improving industrial momentum but still signals contraction.
Political Risk: Tariff escalation could shift investor appetite, even if markets right now are focusing on broader macro narratives.
Volatility Setup: The combination of thin liquidity, tariff uncertainty, and critical data makes for a potentially choppy week.
📌 #trading #stockmarket #economy #inflation #tariffs #Fed #CPI #manufacturing #technicalanalysis

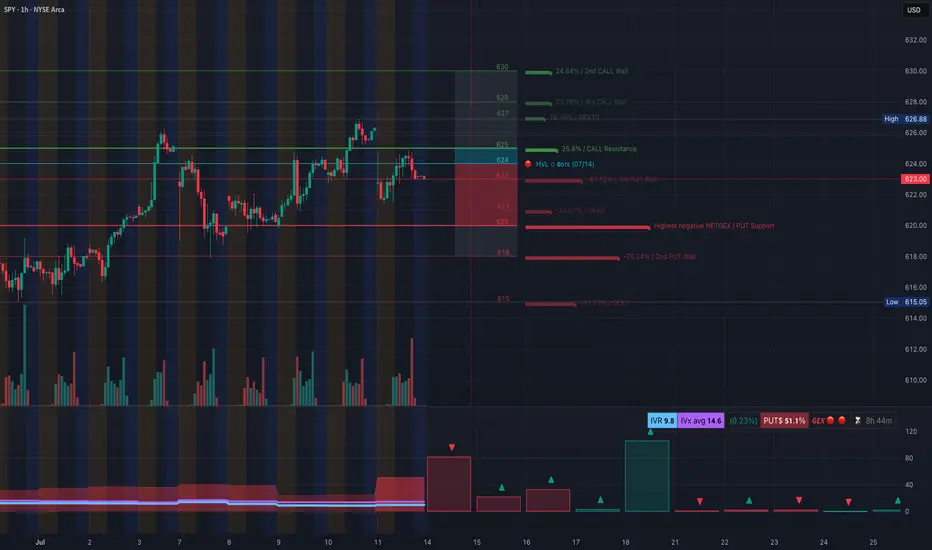
SPY: Bearish Gamma Pin Threatens Breakdown. TA for July 14SPY: Bearish Gamma Pin Threatens Breakdown – What to Watch This Week 🧨
🔸 GEX-Based Options Sentiment (Tanuki GEX Zone)
* GEX Summary:
* Highest Call Wall (Resistance): 625–628 → strong resistance zone.
* Highest Put Wall (Support): 618 → major gamma defense line.
* GEX Flip Zone / NETGEX Support: around 620, where negative gamma begins accelerating downside moves.
* Current GEX Bias: Bearish
* GEX: 🔴
* IVR: 9.8 (very low)
* PUTs %: 51.1% (risk off bias)
* Call walls stack above, forming a clear ceiling.
* Interpretation & Options Strategy:
* As long as SPY trades below 625, the call resistance stack and bearish gamma exposure favor PUT buyers.
* Breakdown below 620 may trigger an acceleration to 617 and even 615 where deeper PUT walls exist.
* Avoid calls until SPY reclaims and holds 626.88+.
* ✅ Suggested Options Play (Bearish Bias):
* PUT 620p / 618p, 0DTE–2DTE if under 623.
* Stop if price holds and reclaims 625.50+ with volume.
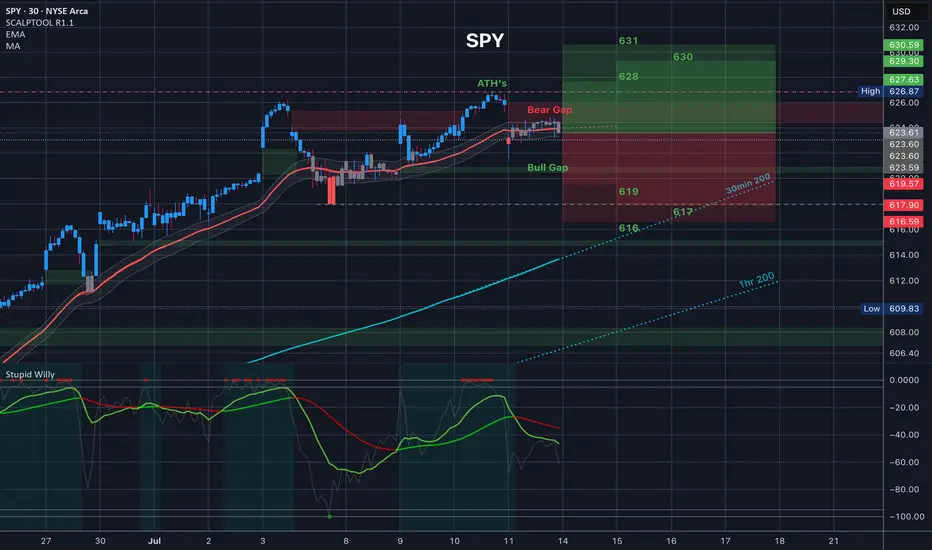
🟦 1H Chart Analysis – Price Action, SMC, and Trade Setups
* Market Structure:
* After the recent BOS, price formed a tight rising wedge, then broke CHOCH and now sits inside a retest box.
* This shows distribution behavior and vulnerability to breakdown.
* A clear CHOCH + BOS sequence is already completed on the 1H.
* Current Range & Zones:
* Consolidation Box: 621.50–625.50
* Trendline Support (lower channel): 621–620
* Demand Zone (H1): 617–618
* Critical Liquidity Below: 615–613.50
* Trade Setup – Scalp/Swing View:
Bearish Scenario (More Likely):
* 🔻 Entry: Under 623 with confirmation
* 📉 Target 1: 620
* 📉 Target 2: 617.50
* ❌ SL: 625.50
* 📈 Optional hedge/reversal: Flip long if 626.88 reclaims (very aggressive).
* Bullish Scenario (Low Probability unless reclaim):
* ✅ Entry: Above 627
* 🎯 Target 1: 629–630
* ❌ SL: Below 625
🧠 Final Thoughts:
* SPY is currently sitting in a gamma trap zone, where it’s pinned between major put support (620) and call resistance (625+).
* If price slips below 620, gamma forces could rapidly drive it to 617–615 zone.
* Until we see strength above 626.88, the path of least resistance remains down.
⚠️ Disclaimer:
This analysis is for educational purposes only. Always do your own research and manage risk properly before trading.
$SPY Tomorrow’s Trading Range and everything in it /// 7.14.25Tomorrow’s Trading range and everything in it. How are you playing it?
Weekly $SPY / $SPX Scenarios for July 14–18, 2025🔮 Weekly AMEX:SPY / SP:SPX Scenarios for July 14–18, 2025 🔮
🌍 Market-Moving News 🌍
⚖️ Powell Faces ‘Epic’ Trade‑Inflation Dilemma
Former Fed economists warn Chair Powell is navigating nearly unprecedented terrain: tariffs are pushing up prices even as the labor market cools. Striking a balance between inflation control and growth support remains a formidable challenge
📊 Tariff‑Driven Inflation May Peak This Week
June’s CPI is expected to show a 0.3% month-on-month increase, potentially lifting core inflation to ~2.7%—its highest level in 18 months. These data will heavily influence the Fed’s decision-making process
🏦 Big Bank Earnings Kick Off
Earnings season begins with JPMorgan ( NYSE:JPM ), Goldman Sachs ( NYSE:GS ), Wells Fargo ( NYSE:WFC ), and Citigroup ($C) reporting. Strong results could offset trade and inflation anxieties; expect volatility in financials
📈 Goldman Sees Broader S&P Rally
Goldman Sachs projects the S&P 500 to climb roughly 11% to 6,900 by mid‑2026, underpinned by firm earnings and expected Fed rate cuts. But warns that breadth remains narrow, increasing downside risk without robust participation
⚠️ Summer Volatility Risk Lingers
Deutsche Bank warns that summer’s low liquidity and the looming Aug 1 tariff re‑imposition deadline may spark sudden market turbulence—even amid bullish sentiment
📊 Key Data Releases & Events 📊
📅 Monday, July 14
Quiet start—markets digest back-to-back CPI, tariffs, and clearing post‑earnings.
📅 Tuesday, July 15
8:30 AM ET – Consumer Price Index (June)
Watch for potential tariff impact in CPI; core inflation data are crucial.
8:30 AM ET – Core CPI (June)
10:00 AM ET – Empire State Manufacturing Survey (July)
Early view on Northeast factory trends.
📅 Wednesday, July 16
8:30 AM ET – Producer Price Index (June)
Wholesale inflation signals to validate CPI trends.
10:00 AM ET – Housing Starts & Building Permits (June)
📅 Thursday, July 17
8:30 AM ET – Initial & Continuing Jobless Claims
A gauge on labor-market resilience amid talks of cooling.
📅 Friday, July 18
10:00 AM ET – Federal Reserve Beige Book Release
Fed’s regional economic snapshot ahead of next FOMC.
⚠️ Disclaimer:
This is for educational/informational use only—not financial advice. Consult a licensed professional before investing.
📌 #trading #stockmarket #economy #tariffs #inflation #earnings #Fed #CPI #technicalanalysis

SpyBig week here. Rarely do you get big banks and big tech earnings on the same week..
Jpm, Goldman sach, and JNJ are dow jones heavy weights.
This is important because I think Dow will close that gap at 44,850 and most likely retest ATH at around 45,000.
As long as dow closes above 44,200 Monday, they will do this move
Now logically you have to ask yourself, If Dow jones moves 800pts or 2% what will spy do?
Well unless Nasdaq gives it all up early in the week then Spy will grind higher..
NASDAQ:QQQ
2hour chart is mimicking
June's price action
Even similar bearish Divergence on RSI
So will tech Roll over this week?
TSM and NFLX both reporting..
Qqq 30min price action, as long as price holds above 548.50 I wouldn't short this at all
As you can see with the yellow channel price will be range trading between 551-555. Over 558 and 560 comes.. below 548 and 544 comes.
This is actionable trading, I know some of you want a bigger picture on the short side but until we break below the 20sma I really don't like going full bear at the beginning of earning season...
Yes, alot of things are flashing red signaling a major correction is looming , for Example here's XLC. This is the sector of NASDAQ:NFLX and NASDAQ:META
Here's the weekly chart and RSI
Very bearish bigger picture here, I could easily see this sector and the big names inside it going back to April lows
But then You have AMEX:XLY
The sector of NASDAQ:AMZN and NASDAQ:TSLA
Nothing is bearish Herr and as long as it holds 217 they are going to push this back to ATH.
NASDAQ:AMZN chart is completely identical
So let's say NFLX and Meta have down days similar to last Friday but Amzn and Tsla pumps then you will get a small pullback unless the chipsector dumps also 😉. Remember there's always a bull in the market, they'll just rotate into something less overbought..
Only time you really see majority selling off is when there is a catalyst (Carry trade, tariffs) or Seasonality (March, Sept)..
So I'm bearish on Chips NASDAQ:SMH and I'm bearish on AMEX:XLC but you have to be selective..
I wouldn't short
NASDAQ:TSLA
NASDAQ:AMZN
NASDAQ:GOOGL
NASDAQ:AAPL
Those stocks will likely outperform this Quarter.
As far as the banks earnings , even if they pop, I think this will be a sell the news event and this sector AMEX:XLF (Big banks) is headed for a massive correction
The Small banks AMEX:KRE
Have almost completed their V shape recovery and will most likely correct after this week
Daily technicals are overbought similar to IWM but the weekly is where you see caution
Top of weekly Bollingerband always leads to a major sell the following week
AMEX:SPY
15min chart
I'm bullish early in the week, I think they will buy the dip ahead of earnings so if they open up near Friday's low or the 15min 200sma they could buy it there, below 621 and they will go for the gap close at 620; that will be another dip buy opportunity . Stop loss 619.00
Below 619.00 and they have a gap left open at 614.84 to close. Stop loss 15min 200ma
Trade Idea of the week is NASDAQ:GOOGL
Bullish ascending triangle forming under 182.00 resistance.. Price may breakout this week
4hour chart Friday finished with a Shooting star so we could start the week with a pullback but I think googl will hold 177.00 support and that's a good entry for a long.. or wait for conformation which would be a break above 182.00..
So 177 or 182 is my entry
Googl is only bearish below 172.00 or 200ma
Personal opinion This administration Has promised 200 trade deals and have gotten only 3 so far. As we get closer and closer to August investors will get nervous and I think we will see another major sell! He's has kicked the tariff can down the road as far as it can go and still these countries are calling his bluff. Becareful because I think the next time trump won't fold