Nightly $SPY / $SPX Scenarios for March 20, 2025🔮 🔮
🌍 Market-Moving News 🌍:
🇨🇳🏦 People's Bank of China (PBOC) Interest Rate Decision 🏦: On March 20, the PBOC will announce its latest interest rate decision. While specific expectations are not detailed, any adjustments could influence global markets, particularly in the Asia-Pacific region.
🇬🇧🏦 Bank of England Interest Rate Decision 🏦: The Bank of England is scheduled to announce its interest rate decision on March 20. Analysts anticipate that the central bank will maintain the current rate at 4.5%, following a recent reduction. This decision will be closely watched for its implications on the UK economy and global financial markets.
📊 Key Data Releases 📊:
📅 Thursday, March 20:
📉 Initial Jobless Claims (8:30 AM ET) 📉:This weekly report indicates the number of individuals filing for unemployment benefits for the first time, providing insight into the labor market's health.
Forecast: 225,000
Previous: 220,000
🏭 Philadelphia Fed Manufacturing Index (8:30 AM ET) 🏭:This index measures manufacturing activity in the Philadelphia Federal Reserve district, with positive numbers indicating expansion.
Forecast: 10.0
Previous: 18.1
🏠 Existing Home Sales (10:00 AM ET) 🏠:This data reflects the annualized number of previously constructed homes sold during the prior month, offering insights into the housing market's strength.
Forecast: 3.95 million annualized units
Previous: 4.08 million annualized units
⚠️ Disclaimer: This information is for educational and informational purposes only and should not be construed as financial advice. Always consult with a professional financial advisor before making investment decisions.⚠️
📌 #trading #stockmarket #economy #news #trendtao #charting #technicalanalysis
SPY trade ideas
SPY'S FIRST BUY SIGNAL SINCE MARCH 26, 2020 CONFIRMED!!!In this video where back on AMEX:SPY 2 day chart with an update on our legendary buy signal that printed for the first time since March2020

SPY rally done soon?My overall thesis is we are in the very early stages of a multi-year decline ultimately with the S&P 500 below 3500. I have been wrong many times before so I will just take this thing in stages and see if it plays out. After this massive decline, we should be in for a great market rally of many decades. I am expecting the market to end its recent rally this week. The current rarely would be about a week in length depending when it began for individual stocks. The rally has done a few important things with its slow and prolonged upward movement, mainly prevents a wave 3 signal from occurring during the next decline.
My wave 3 indicator tends to signal wave 3s and 3 of 3s. See my scripts for the specifics of the indicator. If the market had a short wave 4 up and then a sharp or prolonged drop during wave 5, a new wave 3 signal would occur which violates the currently placed Minor wave 3 (yellow 3). Allowing separation from the current wave 3 signal enables wave 5 to drop quick or slow.
This chart applies select movement extensions based on wave 1's movement on the left and then another based on wave 3's movement on the right. I keep the values between 0%-100% on the chart for wave 2s and 4s retracements of the preceding wave's movement for reference even though the retracement values would be inverted.
Specifically for SPY, Minor wave 3 was longer than wave 1, which does not place a maximum length on wave 5. Assuming wave 4 ends on Thursday or Friday, Minor wave 5 could be a week or longer. In that time, at the very least it should drop below wave 3's bottom of 549.68. Using some basic movement extensions, it will likely go lower. The 5 wave lower pattern for this fifth wave is hypothetical, but a bottom could occur between 525-538. Once we bottom, we should see another rally over a few weeks. I will forecast what that could look like as Intermediate wave 1 nears its end.
Another possibility that could play out is we rally through the weekend. In this case Intermediate wave 1 possibly ended at the current Minor 3 bottom. This would mean we are in Intermediate wave 2 now. I will evaluate this solution if the rally continues next week.

A Clear Bottom. Headed North? Hey Traders,
We're back again with another SPY prediction as the last one we had from Feb. 1st was spot on with the big sell off of 10% from the top.
This is shortly after the FOMC news which has interest rates unchanged, however, market sentiment seemed to like it as the moving averages came to a head and we had some serious buying after 2pm.
I'd like to point out that there is a few good things happening aside from the market. The astronauts are being rescued, Ukraine and Russia and working on a deal, and inflation rates have been coming down.
On a technical note, we broke out of the downward channel and we're breaking above longer timeframe moving averages.
I'm going to assume the direction is north, somewhere in the region of 580 as short-term target.
Let's see what happens in the next 2 weeks.
Thanks for reading!

Trading Is Not Gambling : Become A Better Trade Part IOver the last few weeks/months, I've tried to help hundreds of traders learn the difference between trading and gambling.
Trading is where you take measured (risk-restricted) attempts to profit from market moves.
Gambling is where you let your emotions and GREED overtake your risk management decisions - going to BIG WINS on every trade.
I think of gambling in the stock market as a person who continually looks for the big 50% to 150%++ gains on options every day. Someone who will pass up the 20%, 30%, and 40% profits and "let it ride to HERO or ZERO" on most trades.
That's not trading. That's flat-out GAMBLING.
I'm going to start a new series of training videos to try to help you understand how trading operates and how you need to learn to protect capital while taking strategic opportunities for profits and growth.
This is not going to be some dumbed-down example of how to trade. I'm going to try to explain the DOs and DO N'Ts of trading vs. gambling.
If you want to be a gambler - then get used to being broke most of the time.
I'll work on this video's subsequent parts later today and this week.
I hope this helps. At least it is a starting point for what I want to teach all of you.
Get some.
#trading #research #investing #tradingalgos #tradingsignals #cycles #fibonacci #elliotwave #modelingsystems #stocks #bitcoin #btcusd #cryptos #spy #gold #nq #investing #trading #spytrading #spymarket #tradingmarket #stockmarket #silver

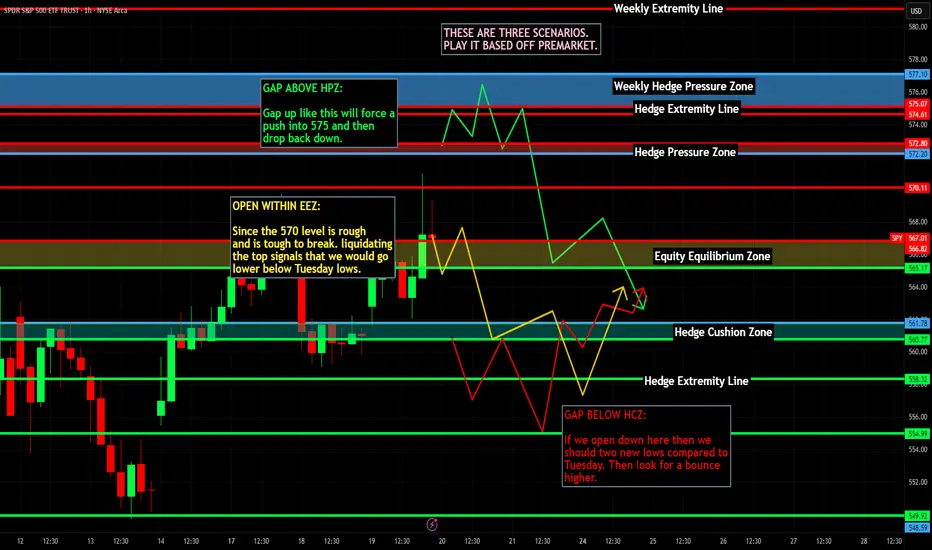
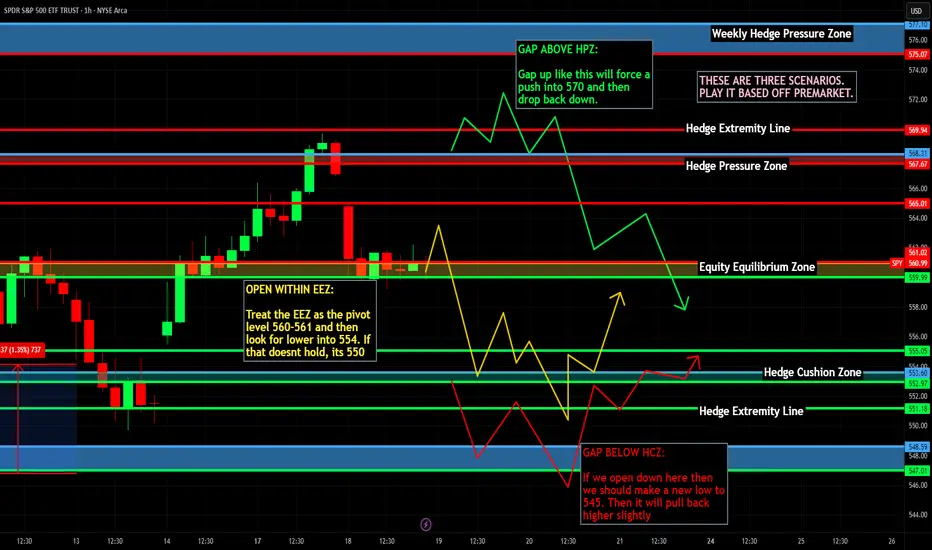
$SPY - Trading Levels for March 19 2025
Today’s Trading Range
The Down-gap from yesterday is near the top of the implied move and the downgap from last week is at the top of the trading range with the big moving averages. With the 30min 200 coming down.
The 200DMA still has a little big of momentum in.
At the bottom to the implied move for the next two days there’s an up gap from last Friday.
I’m excited.

$SPY March 19, 2025AMEX:SPY March 19, 2025
15 Minutes.
50% retracement done for the move 549 to 569
Foe the fall 569.71 to 559.07 563-564 is good levels to short.
But we have converging moving averages in 9,21,100 and 200. So 559 +- should be a strong support.
As of now i am looking for longs above 568.

SPY: 20 DMA rejectionSPY have a very clear wave down and will most likely rally back into the 20 day will it will be rejected for another leg down. Be cautious.
Nightly $SPY / $SPX Scenarios for March 19, 2025 🔮 🔮
🌍 Market-Moving News 🌍:
🇺🇸🏦 Federal Reserve Interest Rate Decision 🏦: The Federal Open Market Committee (FOMC) will announce its interest rate decision on Wednesday, March 19, at 2:00 PM ET, followed by a press conference with Fed Chair Jerome Powell at 2:30 PM ET. The Fed is widely expected to maintain the federal funds rate at its current range of 4.25% to 4.5%. Investors will closely monitor the Fed's economic projections and Powell's comments for insights into future monetary policy, especially in light of ongoing trade tensions and global economic uncertainties.
🇯🇵💴 Bank of Japan Monetary Policy Decision 💴: The Bank of Japan (BOJ) is set to announce its monetary policy decision on March 19. The BOJ is expected to keep interest rates steady, as policymakers assess the potential impact of U.S. trade policies on Japan's export-driven economy. The yen has remained stable ahead of the announcement, with traders awaiting the BOJ's guidance on future monetary policy.
📊 Key Data Releases 📊:
📅 Wednesday, March 19:
🏢 Existing Home Sales (10:00 AM ET) 🏢:This report measures the annualized number of existing residential buildings sold during the previous month, providing insight into the strength of the housing market.
Forecast: 5.50 million annualized units
Previous: 5.47 million annualized units
⚠️ Disclaimer: This information is for educational and informational purposes only and should not be construed as financial advice. Always consult with a professional financial advisor before making investment decisions.⚠️
📌 #trading #stockmarket #economy #news #trendtao #charting #technicalanalysis
SPY at Critical Resistance – Breakout or Pullback Ahead?📊 AMEX:SPY Monthly Macro Outlook 📊
Key Observations:
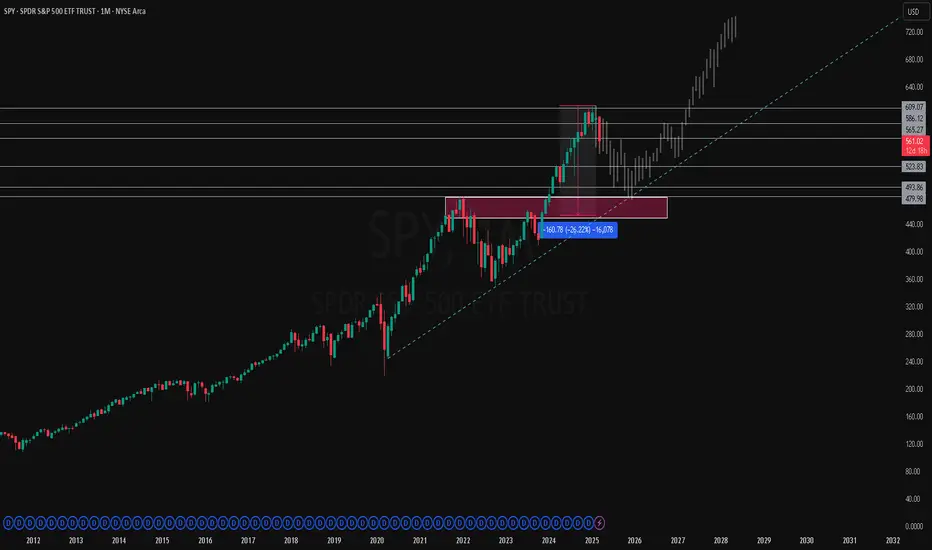
1️⃣ Long-Term Uptrend Intact – Despite corrections, AMEX:SPY remains in a strong bullish trend, respecting the multi-year trendline since 2009.
2️⃣ Historical Pullback & Recovery – The 2022 market correction (-26%) found strong demand in the highlighted red zone (around $480-$500), leading to a powerful reversal.
3️⃣ Resistance Levels in Play – Price is currently testing key resistance levels at $565, $586, and $609. A rejection here could lead to a healthy pullback before continuation.
4️⃣ Future Outlook – If price consolidates and holds above $565, we could see an attempt to break $609, with the long-term trajectory targeting $700+ in coming years.
Trade Plan:
🔹 Bullish Scenario – A breakout above $609 could lead to price discovery, targeting $650-$700 in 2026-2027.
🔹 Bearish Scenario – A rejection at $565-$609 could trigger a retrace to $523 or $480, offering a buy-the-dip opportunity.
🔹 Invalidation – If AMEX:SPY loses $480 support, the bullish thesis weakens, and deeper downside may be in play.
📈 The trend is your friend, but expect volatility at these levels! Do you see a breakout coming or a healthy pullback first? Drop your thoughts below! 👇
#SPY #StockMarket #Investing #Trading #MacroAnalysis
Socials: @KennyTrades52
$SPY $SPX OLD CHART BAR PATTERN COVID CRASH NOW!!!!Holy crap.... I just came across an old chart and literally in the nick of timeI tell you. All I'm going to say is... I'm a pattern chart trader and this is the COVID bar pattern attached to our daily from like a year ago almost and I loaded up an old layout to do work and boom... here we are... Good LUCK ... Not sure what the trigger will be but we are here.

$SPY I know this is crazy, but $576 is my number, Call me maybe?$576 Gap fill on the way? Time will tell that's for sure. My expecation is that we sell into the beginning of March Covid style in a way. $576 seems good for right now. Will update as we go.

Spy Road To $544 UPDATEIts Playing out Accordingly Spy $544! Do I think it's going exactly to $544 yes, what I'm trying to figure out is if that's the bottom , $530-510 are extreme levels for this to happen in theory it would shock the whole market in Fear causing many People to Release their positions and then Resulting in a drastic fast Blow off Topp All Time Highs , But in the meantime let's see how this plays out!!! We have a Government Shutdown Decision in literally 2hrs this will really rock the markets... We have a really interesting options chain We have way more supply than demand not looking to for Covers when selling pressure accurse this makes me think easy drop to the downside like butter, technicals dont look that great we are under the 200ema now going on 2 weeks!!! THESIS IS BEARISH PREPARE FOR THE DOWNSIDE!!!!! as always Safe Trades Traders

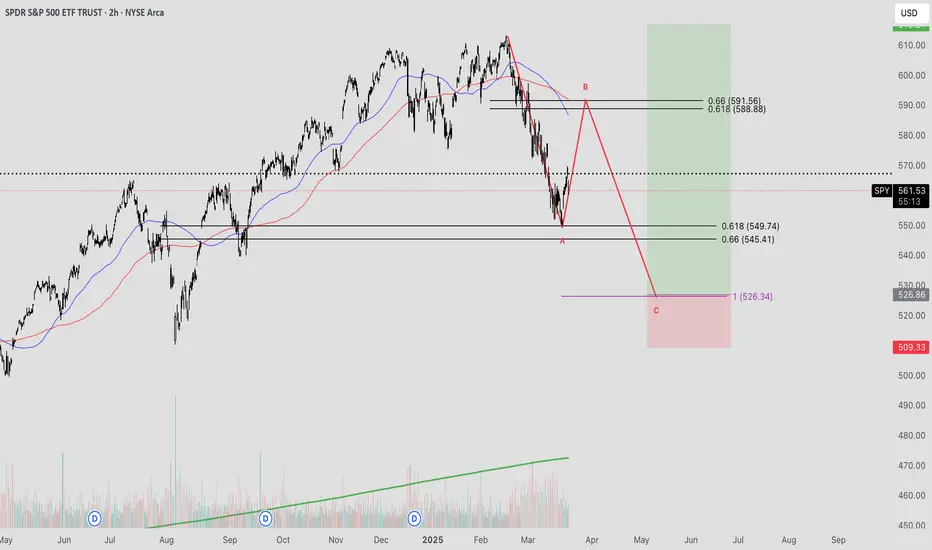
SPY: Opportunity on the HorizonThe SPY has undergone what some might characterize as a strategically influenced decline, following an extreme three-standard-deviation move to the downside in under 20 days. The market appears to be adjusting its expectations in response to the evolving policy landscape under Trump’s administration and the broader transition to a new government.
I am inclined to believe this as a form of "controlled demolition," potentially orchestrated to accelerate the Federal Reserve’s decision to cut interest rates sooner rather than later.
With this in mind, I will remain attentive to the broader market structure, particularly monitoring for a potential ABC corrective pattern that could shape near-term price action.
At the moment, price is rebounding from a critical support zone, aligning with the 0.618 Fibonacci retracement of the uptrend initiated in November 2024. Given the market's current state of being significantly oversold, a period of relief would be preferable to provide liquidity at higher price levels.
The immediate target for this retracement is the 0.618 level of the ongoing downtrend, which coincides with the previous range’s Value Area Low or potentially the Point of Control should a stronger rally materialize.
Beyond this, the anticipated broader ABC correction is expected to unfold, with a target around 530 on the SPY—precisely at the major VWAP level from late 2023, which previously marked the end of the bear market. This level is further in confluence with the 1-1 trend based Fibonacci extension of the swing high, which may signal the magnitude of the corrective move. I will have a better idea of where the correction may conclude once the swing high is in.
This decline is likely to present substantial opportunities for both long-term investors and active traders alike.
Let’s see how the market dynamics evolve from here.
SPY intraday set up Looking at key trend-lines, moving averages, channels and price action to get a look at potential areas to aim for.

SPY/QQQ Plan Your Trade For 3-18-25 : Gap Reversal Counter-TrendFirst off, thank you for all the great comments and feedback. I really love hearing from TradingView subscribers and how my research is helping everyone find success.
Just recently, I received some DMs from viewers saying my research has been "dead on" - which is great.
One thing is for sure, the big move in Gold/Silver is just getting started.
Today's SPY Cycle Pattern is a Gap-Reversal in a Counter Trend mode. The long-term & short-term bias is currently BEARISH - so I believe the GAP Reversal will be to the upside.
Meaning, I suggest we start the day with a mild lower GAP - followed by a moderate price reversal in early trading, leading to a continued melt-up type of trend for the SPY/QQQ
Gold and Silver are likely to attempt to melt a bit higher into the TOP pattern for today. I believe this is just a temporary resistance level for metals.
Bitcoin is struggling to find upward momentum - but I believe BTCUSD still has a $3k-$5k rally left to reach the current Consolidation highs. We'll see if it breaks higher over the next 3-5 days before rolling over into a new downtrend.
Again, I really appreciate all of my followers and viewers. I want all of you to learn to see, read, and understand price action more clearly than ever before.
That's why I don't use any technical indicators on my chart. I want you to understand PRICE is the ultimate indicator.
Get some..
#trading #research #investing #tradingalgos #tradingsignals #cycles #fibonacci #elliotwave #modelingsystems #stocks #bitcoin #btcusd #cryptos #spy #gold #nq #investing #trading #spytrading #spymarket #tradingmarket #stockmarket #silver

$SPY - Trading Levels for March 18 2025
Not too much to write today because I’m on Spring Break and even though I am trading I’m not at my computer as much.
You can see the levels running through the chart. They are all labelled the bear gap is there holding the 35EMA and the 200DMA - that is big.
We are Neutral bearish here being above the 30min 25EMA but under the 30min 200MA
Grab this chart and let's GO!!!

SPY: Breakout from descending channel, rebound underwayThe SPY (ETF tracking the S&P 500) has just broken upward from a clearly defined short-term descending channel identified by the Adaptive Trend Finder (ATF) indicator. This indicator automatically detects the current dominant trend (here at 150 periods) with high relevance, as evidenced by the strong correlation highlighted by the indicator.
Prices are currently moving towards the Hull Moving Average (HMA), which acts as a dynamic short-term resistance. A confirmed close above the HMA (blue line) would strengthen the bullish scenario.
Fractals validated by the Williams Fractals Ultimate indicator also support this rebound, indicating a potential reversal towards the median line of the long-term channel defined by ATF (1200 periods).
Monitor the relative volume (RVOL), currently low, to confirm the bullish recovery. An increase in volume would strengthen the conviction of a sustained upward movement.


SPY $561p FOMC Wednesday, today we had 2 higher time frame fair value gaps (FVG) 1 on the daily created last Monday and today we turned that into an inversed fair value gap (IFVG). as well we have a daily on Friday around the $560 area aswell as a news low witch is a solid target. at the heights of today we wicked across a 2h FVG and it was fully respected this plus it tested the 200MA (white) and failed so this is giving me full confidence for SPY puts into $560 expiration would be for Wednesday and would try to trim enough to carry a free put or 2 through FOMC $535 LOTTO for friday aswell :)

Nightly $SPY / $SPX Scenarios for March 18, 2025 🔮 🔮
🌍 Market-Moving News 🌍:
🇺🇸🏛️ Federal Reserve Meeting Commences 🏛️: The Federal Open Market Committee (FOMC) begins its two-day policy meeting on March 18, with a decision on interest rates expected on March 19. While markets anticipate that the Fed will maintain current rates between 4.25% and 4.5%, investors will closely monitor the meeting for any signals regarding future monetary policy directions.
🇨🇳📊 China's Economic Data Release 📊: China is set to release key economic indicators, including retail sales and industrial production figures for February. These data points will offer insights into the health of the world's second-largest economy and could have ripple effects on global markets, including the U.S.
📊 Key Data Releases 📊:
📅 Tuesday, March 18:
🏠 Housing Starts (8:30 AM ET) 🏠:This report measures the number of new residential construction projects begun during the month, providing insight into the housing market's strength.
Forecast: 1.31 million units (annualized)
Previous: 1.34 million units
🏢 Building Permits (8:30 AM ET) 🏢:This data indicates the number of permits issued for new construction projects, serving as a leading indicator for future housing activity.
Forecast: 1.35 million units (annualized)
Previous: 1.36 million units
⚠️ Disclaimer: This information is for educational and informational purposes only and should not be construed as financial advice. Always consult with a professional financial advisor before making investment decisions.⚠️
📌 #trading #stockmarket #economy #news #trendtao #charting #technicalanalysis

SPY: HAMMER TIME!!! Multiple Confluences!Fundamentals : Ignore all the boohoo!
Technicals :
Hammer time!
VPA confirmation
uHd
ext. indicator
61.8% fib support
horizontal support
all this = multiple confluences

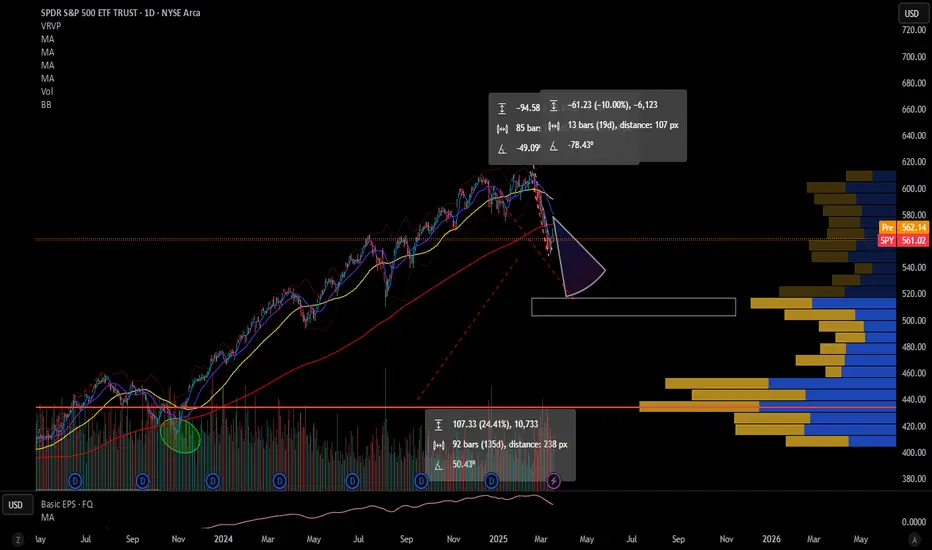
SPY is likely to find support between 530 and 550The SPY ETF (SPDR S&P 500 ETF Trust) recently peaked at 613.23, reaching the upper boundary of a long-term channel that has been in place since 2009. This suggests the market is in an overbought state. Looking at historical trends suggests that the continuation of previous upward trends became unsustainable after reaching critical levels. The current correction signals that the market is adjusting toward a healthier upward trend.
The long-term trend since 2009 remains intact. However, the upward trend that began in 2023 is broken, with the price now trading below the 200-day moving average and previous lows. Overall, the long-term trend is strong, and historical momentum suggests that SPY could find support between 530 and 550. In a worst-case scenario, the price may decline toward the key support zone of 490 to 500. The recent correction also suggests that any rebound could be sharp and V-shaped.
