SQQQ | Im Very Bearish the Markets Going into Q1 - 2025How I see It: (The commentary is purely my own thoughts based on my research comparing it to what I've seen in the media and other social media sites)
SQQQ smooths out the noise and shows me if we are in a bearish scenario in the technology sector.
This ETF has been in a bullish divergence for the
Key stats
About PROSHARES TRUST
Home page
Inception date
Feb 9, 2010
Structure
Open-Ended Fund
Replication method
Synthetic
Dividend treatment
Distributes
Distribution tax treatment
Ordinary income
Income tax type
Capital Gains
Max ST capital gains rate
39.60%
Max LT capital gains rate
20.00%
Primary advisor
ProShare Advisors LLC
Distributor
SEI Investments Distribution Co.
SQQQ is an aggressive take on the large-cap space by providing geared inverse (-3x) exposure to the NASDAQ-100 index – an index of 100 tech-heavy firms listed on NASDAQ that excludes financials. To provide this exposure, the fund uses swaps on the popular NASDAQ-100 ETF (QQQ), swaps on the index itself, and futures. As with most inverse and leveraged products, SQQQ is designed to provide this exposure on a daily basis, not over long time horizons. Holding the fund for longer than a day opens the door to the effects of compounding on returns and will be unlikely to realize the stated -3x inverse exposure over time especially in volatile markets.
Classification
What's in the fund
Exposure type
Government
Stock breakdown by region
Top 10 holdings

SQQQ (3X Inverse Nasdaq) VS NUGT (2X Gold Bull)Interesting. SQQQ lags behind NUGT slightly as the two charts are compared.
Most interesting is the most recent movement. In most points on the chart the two variables are within 20% of each other in regards to their movement from zero change.
However, in the last time period of the chart (fin

Nasdaq vs SQQQSQQQ-solid
Nasdaq-hollow
Trend appears to be reversing, where SQQQ will begin trending positive, and Nasdaq negative.

Nasdaq vs SQQQ, 1 year daily chartThe pattern emerging shows the convergence between the two trend lines. The trend lines show the change from zero, indicating positive or negative trend. The trends are currently at a point where SQQQ is beginning to trend positively, as Nasdaq tests the negative direction. That leads to the cros

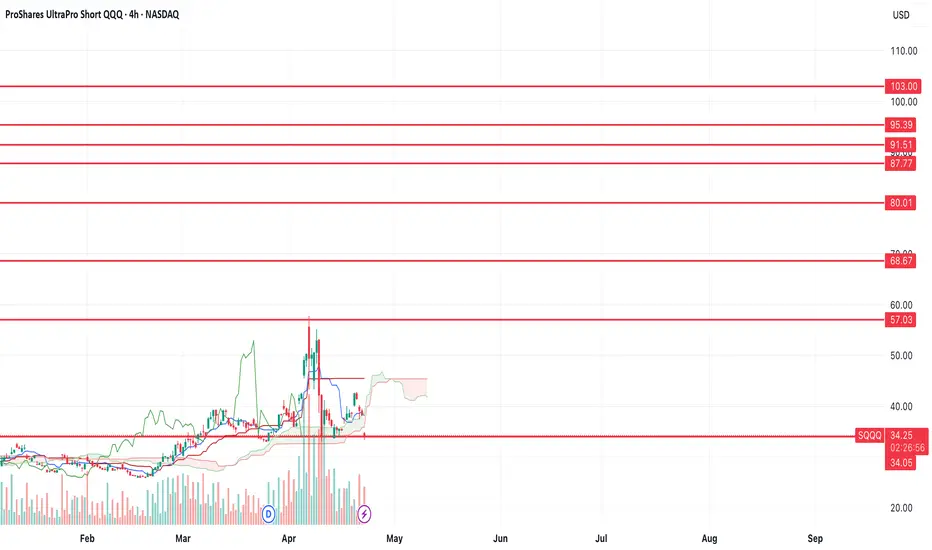
$SQQQ - $68-103 targetIf we look at the chart of SQQQ, we can see that we're holding support here at the $34 level.
If we continue to hold here, we'll have a failed head and shoulders breakdown. I think if we can break the highs at $57, it is very likely that we'll see $68+.
Let's see how it plays out in the coming wee
SQQQ Five disparate geometric targets at 50Five targets at 50:
1. Bull flag breakout measured move to 50
2. 50% Fib retracement from 64.95 previous high to recent low at 26.21 = 50
3&4. Schiff modified pitchfork top line at 50 occurring at the same time as the trend line created from the recent move from A to B is applied to the appex B's ve
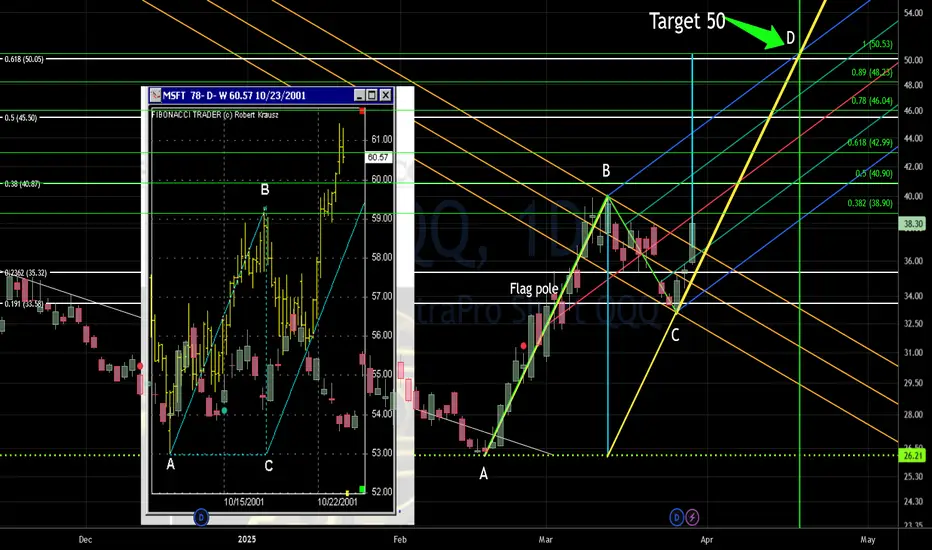
Chart Pattern Analysis Of SQQQ
After K0 break up the long-term downtrend channel,
K3 tested for a first time,
The decreasing volume implies another bull run may keep climbing up.
If the following candles fall to test 0.382fib area,
It will be a good place to buy it there.
And, it is also a good place to buy it here immediately

SQQQ , short I am shorting this now at 30.57 , will update this and future sqqq trades in comments .

ONLY bet with money you can afford to LOSE - SQQQNow, first thing first, this SQQQ ETF is a 3x leverage short ETF, so do trade with caution and
$$ you OK to lose completely.
Next, the Nasdaq has YET to break down from the bullish trend line and even if it does, it could also quickly reverse back. You can make 3x profits AND 3x losses as well wit

buy sqqq 3x nasdaq etf to hedge your long portfolio or as a specbuying the sqqq which is actually getting short the nasdaq mkt. the mkt is over done and due for a significant pullback, i see the naz possibly dropping by 5 % by the end of december

See all ideas
Displays a symbol's price movements over previous years to identify recurring trends.
Related funds
Frequently Asked Questions
An exchange-traded fund (ETF) is a collection of assets (stocks, bonds, commodities, etc.) that track an underlying index and can be bought on an exchange like individual stocks.
SQQQ trades at 29.40 USD today, its price has fallen −9.95% in the past 24 hours. Track more dynamics on SQQQ price chart.
SQQQ net asset value is 23.68 today — it's fallen 42.10% over the past month. NAV represents the total value of the fund's assets less liabilities and serves as a gauge of the fund's performance.
SQQQ assets under management is 3.09 B USD. AUM is an important metric as it reflects the fund's size and can serve as a gauge of how successful the fund is in attracting investors, which, in its turn, can influence decision-making.
SQQQ price has fallen by −9.95% over the last month, and its yearly performance shows a −38.24% decrease. See more dynamics on SQQQ price chart.
NAV returns, another gauge of an ETF dynamics, have fallen by −42.10% over the last month, showed a 3.26% increase in three-month performance and has decreased by −42.94% in a year.
NAV returns, another gauge of an ETF dynamics, have fallen by −42.10% over the last month, showed a 3.26% increase in three-month performance and has decreased by −42.94% in a year.
Since ETFs work like an individual stock, they can be bought and sold on exchanges (e.g. NASDAQ, NYSE, EURONEXT). As it happens with stocks, you need to select a brokerage to access trading. Explore our list of available brokers to find the one to help execute your strategies. Don't forget to do your research before getting to trading. Explore ETFs metrics in our ETF screener to find a reliable opportunity.
SQQQ invests in bonds. See more details in our Analysis section.
SQQQ expense ratio is 0.95%. It's an important metric for helping traders understand the fund's operating costs relative to assets and how expensive it would be to hold the fund.
SQQQ is an inverse fund, meaning it's structured to generate returns opposite to the trends of the underlying index or assets.
Yes, SQQQ pays dividends to its holders with the dividend yield of 12.01%.
SQQQ trades at a premium (0.85%).
Premium/discount to NAV expresses the difference between the ETF’s price and its NAV value. A positive percentage indicates a premium, meaning the ETF trades at a higher price than the calculated NAV. Conversely, a negative percentage indicates a discount, suggesting the ETF trades at a lower price than NAV.
Premium/discount to NAV expresses the difference between the ETF’s price and its NAV value. A positive percentage indicates a premium, meaning the ETF trades at a higher price than the calculated NAV. Conversely, a negative percentage indicates a discount, suggesting the ETF trades at a lower price than NAV.
SQQQ shares are issued by ProShare Advisors LLC
SQQQ follows the NASDAQ 100 Index. ETFs usually track some benchmark seeking to replicate its performance and guide asset selection and objectives.
The fund started trading on Feb 9, 2010.
The fund's management style is passive, meaning it's aiming to replicate the performance of the underlying index by holding assets in the same proportions as the index. The goal is to match the index's returns.