SQQQ Santa rally came early - so does the nest one start on....The reason I added 'so far so good' to the last post was that it was running up and a few days later it broke up above $7 as far as xmas rally It looks like I was off by 2 days. Usually when SQQQ goes below the green line (50 day moving average) it pushes up to the 100 day moving average (the slower Blue Line). This is not an everyday thing - it last did it a few months ago from the beginning to the end of September and ran up 28% then this recent run was short (NOV 22 - DEC 6) but ran up 22%.
The Stochastic RSI (orange and blue lines at the bottom of the chart.) StockRSI show us when it falls to zero on SQQQ it is time to buy and with in a week or a month you will run up 20-30%
This is great in years of sideways chop in the market, as people run from stock into cash and then back to stock again, that high volatility can generate great returns if you can catch the signals. It looks like SQQQ will fall for the rest of the year back below $5 and some equities will run up after Xmas - by then the Covid infection rate should be high which will cast doubt on the markets and scaring people back into cash. It might happen next week it might happen next month. It is hard to say, if you look at the Stochastic RSI it can go down to zero and stay there for a month before it take off again with one of these +20% moves.
This one is a lagging indicator and you can miss it by and inch or a mile.
Not trading advice i did not take this trade -I have been working on perfecting this system for a year and only took one trade on it in the spring. i will save this one in my back pocket for next September when every one sells Rosh Hashana and buys Yom Kippur.
Now that i think about this the Lunar new Year is coming up and that would be a great overlay on this chart for the next pump. has anyone had luck timing this with the luna new year?
SQQQ trade ideas

SQQQ Montly between 26-39$ still a tech bubble that didnt popedmy predictions are the worst, dont follow them.
We've been under the green lower channel and Montly shows that when the market drops, the upper channel is a target.
So you have to understand that a worst scenario for Nasdaq is SQQQ at 70-80$, and still, that would be a sustainable point, we easily went there many times in the last ten years and sentiment was very good and smooth
so Upper channel isn't apocalypse, its just the worst it went during a bull market that last for 15 years
now imagine if its a real recession, a real bubble that pops, and look at 2001 and 2008
that would be much more over the upper channel
SQQQ at 26$ is short term confortable, at 39$, that when economy has some range on the interest rates and no covid
under 39 its a bubble
between 39 and 80$, thats covid wave #2
Over 80$ its the results of two waves on the economy and Trump in prison.

short inverse nasdaq (sqqq)broader market health permitting we should be finding a lower high in sqqq and retracing back into the channel below mean regression and vwap
should we set a lower high than 6.15 and break 6 convincingly i wouldnt be surprused to end up around 5.92

multi day runner short nasdaq has bull momo (sqqq)hedge action has added to the price of short room for bulls to work with. we will probably test some area above postmarket lows and move higher in the beginning of next week


SQQQ is gunna have a Santa Rally SQQQ is gunna have a Santa Rally
time to go all cash for 3 days sometime soon.

$SQQQ to pair with an $AAPL short...If you don't want to play $AAPL, you could just try a long $6.50 at $0.14. Small entry, if there is market capitulation this could get a nice pick up in a two day stretch as a hedge.

$SQQQ little protection here...If we keep dropping you can find some individual names, or what I'll try is a few $6.50 calls on SQQQ see how that works

POSSIBLE INVERSE HEAD AND SHOULDERSPossible inverse head and shoulders on the SQQQ brought to you by Omicron.

Anybody Else Shorting The Market ?This fourth wave is a nice excuse to short the market before we are nearing to Santa rally. Give me a thump up if u are shorting NAS100.
These are my personal thoughts derived mainly from EW and they could be wrong.

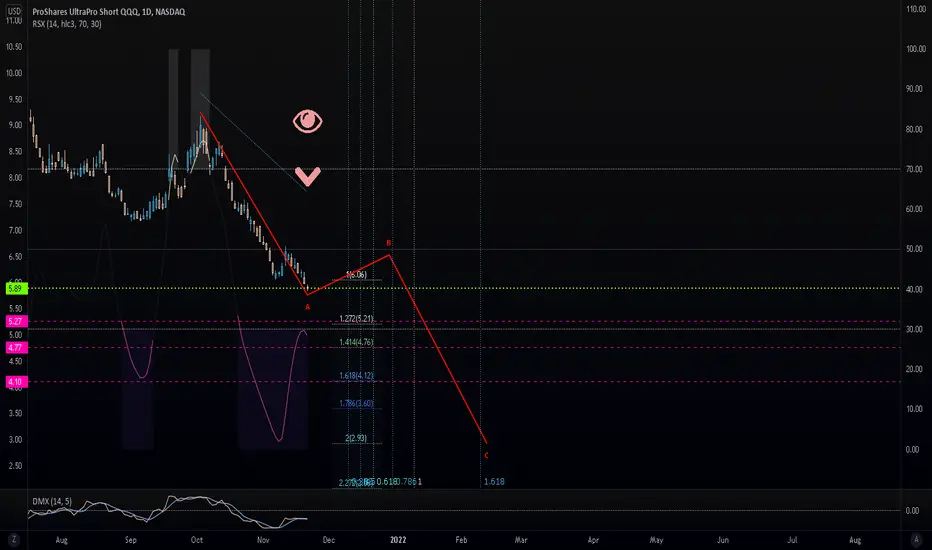
Proshares Shorts is descending lower. SQQQZigzag, broke floor, negative momentum, the trend continues.
We are not in the business of getting every prediction right, no one ever does and that is not the aim of the game. The Fibonacci targets are highlighted in purple with invalidation in red. Fibonacci goals, it is prudent to suggest, are nothing more than mere fractally evident and therefore statistically likely levels that the market will go to. Having said that, the market will always do what it wants and always has a mind of its own. Therefore, none of this is financial advice, so do your own research and rely only on your own analysis. Trading is a true one man sport. Good luck out there and stay safe!
$SQQQ on more downside play...Just playing risk/reward here...if we keep going down, you could grab a next week $7 call for SQQQ at $0.14, maybe 10 of them for $140 to hedge a correction...

Betting Against the market..!Monitoring the volume of reversed ETF shows increased volume against S&P 500 and Dow Jones in the past week!
I will monitor these for possible buy opportunities and benefitting from a possible market correction!
a 3-5% correction could push these higher 9-15%..!
They need to complete a reversal pattern above the green lines first!
Best,
Moshkelgosha
DISCLAIMER
I’m not a certified financial planner/a certified financial analyst, an economist, a CPA, an accountant, or a lawyer. I’m not a finance professional through formal education. The contents on this site are for informational purposes only and do not constitute financial, accounting, or legal advice. I can’t promise that the information shared on my posts is appropriate for you or anyone else. By using this site, you agree to hold me harmless from any ramifications, financial or otherwise, that occur to you as a result of acting on information found on this site.

$SQQQ price actionI believe that this descending triangle for $SQQQ will continue as we dip below $6. I know I have mentioned that I planned to buy at the $7.80-$7.50 range, but never did. Never a fan of shorting anything, but I have enough conviction to test out this play. I will continue to monitor the price action for another entry as I believe a major correction will occur across all sectors in financial markets. Time will tell but this descending triangle will have to cross eventually. Too early to tell for a position and I will look for resistance to find a great entry. STAY TUNED!

SQQQ (Inverse of QQQ) About to Spike Next Week(Opinion only)
Fed meeting next week; I think market pulls back next week ahead of tapering announcement.

Following the First 15 minutes of SQQQ; no stops/targetsjan M(2/1) T(3/1) W(2/2) TH(2/2) F(1/3)
Winning Trades: 10
Loosing Trades: 9
Total: 19
feb M(2/2) T(1/3) W(2/2) TH(3/1) F(2/3)
Winning Trades: 10
Loosing Trades: 10
Total: 20
mar M(3/1) T(3/2) W(5/0) TH(3/1) F(3/1)
Winning Trades: 17
Loosing Trades: 5
Total: 22
apr M(2/2) T(2/2) W(3/1) TH(4/1) F(2/2)
Winning Trades: 13
Loosing Trades: 8
Total: 21
may M(2/2) T(4/0) W(2/2) TH(1/3) F(2/2)
Winning Trades: 11
Loosing Trades: 9
Total: 20
june M(4/0) T(4/1) W(1/4) TH(3/1) F(4/0)
Winning Trades:15
Loosing Trades: 6
Total: 21
july M(1/2) T(3/1) W(4/0) TH(4/1) F(5/0)
Winning Trades: 17
Loosing Trades: 4
Total: 21
aug M(3/2) T(1/4) W(2/2) TH(4/0) F(4/0)
Winning Trades: 15
Loosing Trades: 8
Total: 23
sept M(3/0) T(2/2) W(3/2) TH(3/2) F(4/0)
Winning Trades: 15
Loosing Trades: 6
Total: 21
oct M(2/1) T(2/1) W(0/2) TH(1/1) F(2/3)
Winning Trades: 7
Loosing Trades: 6
Total: 13
Longest Draw-down:6
Longest Win Streak:9
total: 201 M(24/13/37) T(25/17/42) W(24/21/45) TH(28/26/54) F(29/14/43)
w: 130
l: 71
---
1. Fridays seem to perform best
2. Thursdays seem to perform the worst
3. Conclusion:
- Trade on Fridays, Mondays, & Tuesdays.

BTC vs Tech Stock CRASH!The BIG question is whether Bitcoin crashes with a Stock Market Crash, in particular the Tech Stocks. We have an interesting chart here with the SQQQ (Bear ETF on the QQQ's) compared to the BTC price on Bitstamp. There appears to be a correlation that has been showing since May in that BTC has been basing and now breaking out to the upside. The SQQQ has been basing since May as well and has not technically broken out of the base to the upside just yet. However, if you look at our Proprietary Oscillator (Blue Dots) it is positively divergent from the SQQQ price. Our Prop Oscillator is showing that a breakout to the upside on SQQQ is imminent. Since BTC is accelerating to the upside we are expecting BTC to continue higher while the Tech Stocks Crash. The SQQQ chart (without BTC overlay) reminds me of February 2020 when our Prop Oscillator was in a very similar positive divergence. The next couple weeks the price exploded to the upside. Something is coming out at anytime that is going to crash the Tech Stocks and as of now BTC markets should benefit. We will update this chart as we move forward.

i pooped and wiped tdyHi there dumbie pie dumbie pie hi there hi there dumbie pie dumbie pie hi there hi there dumbie pie dumbie pie hi there hi there dumbie pie dumbiepie hi there


SQQQ LONG I've identified a same scale movement in the chart of SQQQ... that has already repeated several times. SAME EXACT SIZE MOVEMENT.
is going to repeat again?

SQQQ PlanBuy at $7.60. Target 12.5% $8.55. Stop -4.5% $7.25.
I believe the QQQ is ready to drop a few points because of September slump psychology. We haven't had a 20% gain on the SQQQ since May. With all the price movement there could be some retracement on the QQQ. I'm setting a tight stop loss because we are still in a bull market. This is a scalp trade.

SQQQScary looking chart isnt? But what if it turns? - You;'d enjoy 3 x the benefits
Every bear is dead. After today. I might join the club or might be the next Michael Burry.

SQQQThis is an outcome of a discussion with a friend @ Bahubali
A message said ' Thanks but No Thanks '
I believe strongly that we should see a gain of around 70 to 120% in this counter.
there are enough technical reasons for it but i will not go into details for now.
