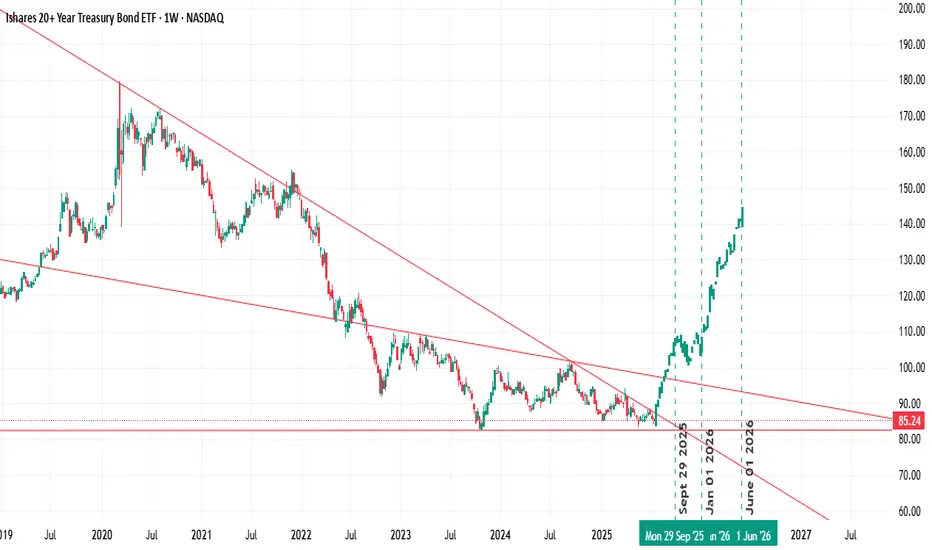
Possible Scenario for the Bond FundSimply took a previous move the Bond Fund already made, and inverted it, copy pasted and voila. It has already happened before
Key stats
About ISHARES TRUST
Home page
Inception date
Jul 22, 2002
Structure
Open-Ended Fund
Replication method
Physical
Dividend treatment
Distributes
Distribution tax treatment
Ordinary income
Income tax type
Capital Gains
Max ST capital gains rate
39.60%
Max LT capital gains rate
20.00%
Primary advisor
BlackRock Fund Advisors
Distributor
BlackRock Investments LLC
While taking a different approach from our benchmark, TLT effectively captures the far end of the Treasury curve in a liquid package. Exclusively holding bonds with 20+ years to maturity, TLT isby designvery sensitive to long-term interest-rate movements. The fund has higher duration than our benchmark, which holds bonds in the 10- to 30-year range. The fund changed its underlying index from the Barclays US 20+ Year Treasury Bond Index to the ICE US Treasury 20+ Year Index on March 31, 2016. This change did not alter the fund's exposure in a meaningful way. TLT is a great choice for investors who want long-term Treasury exposure.
Related funds
Classification
What's in the fund
Exposure type
Government
Stock breakdown by region
Top 10 holdings
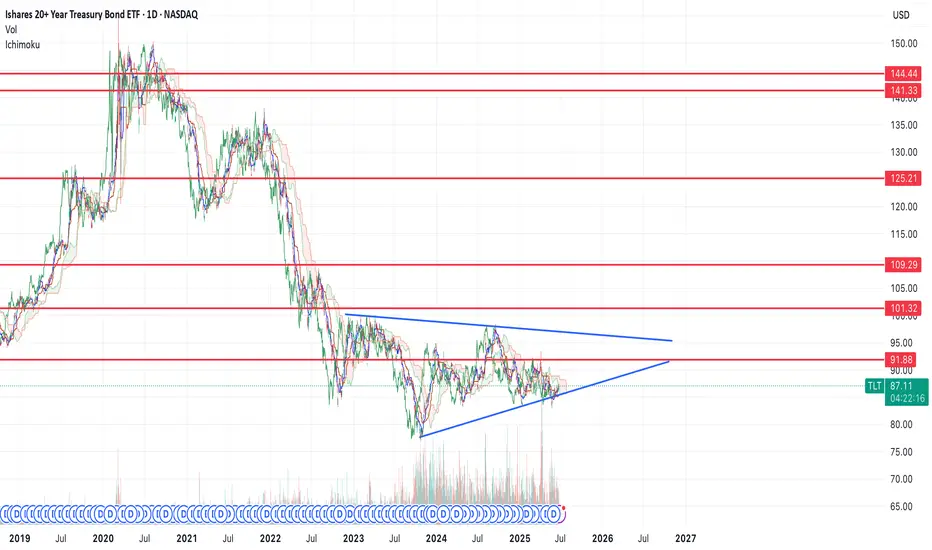
Do we continue the wedge…Bonds have been hit hard and Crypto at Ath trend lines, do we need to finish the wedge
Bottom in for bonds, flight to safety trade coming soon $100+If we look at the chart of TLT, you can see that we're forming a bottoming reversal pattern.
We had a spike low down to $83 back to the middle of May and have now reclaimed the structure. I think that move marked the bottom.
I think it's very likely that bonds spike in the near future, if they can
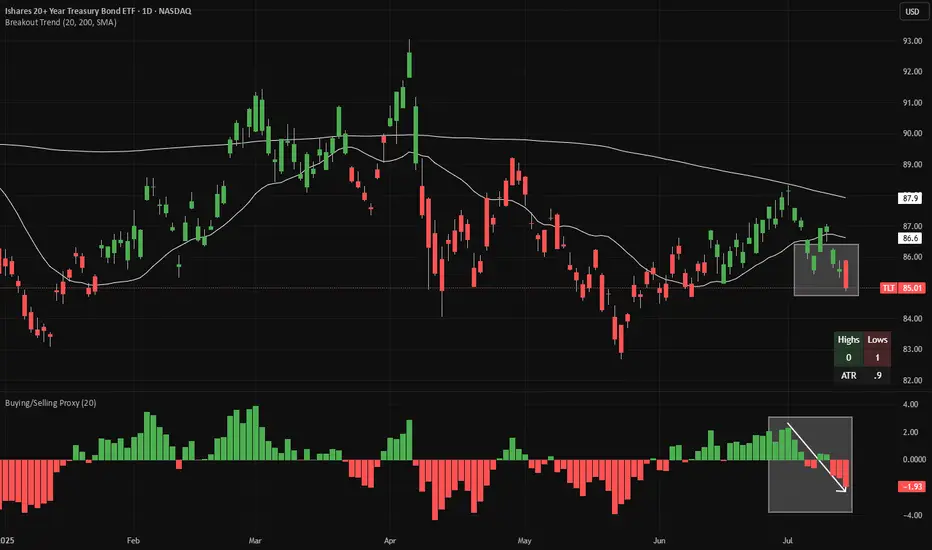
TLT short - warning signs from JapanTLT is making 20-day lows (red candles in the main chart), while continuing to make 20-week lows on a weekly chart (not shown). Meanwhile, looking at a proxy of net buying/selling (bottom panel), we have flipped from buying to selling.
Looking at Japanese bond yields, 10-year JGBs (JP10Y) just brok
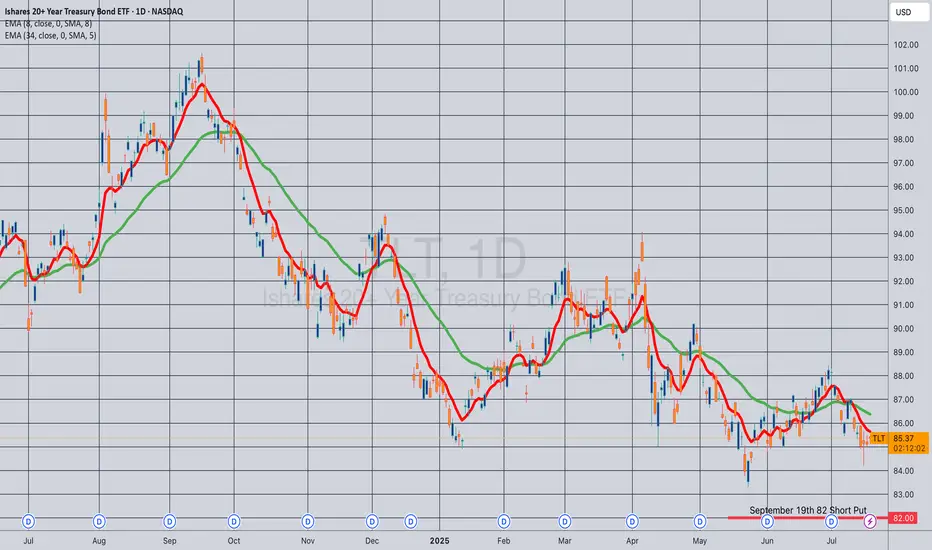
Opening (IRA): TLT September 19th 82 Short Put... for a .90 credit.
Comments: Adding to my position at strikes slightly better than what I currently have on ... .
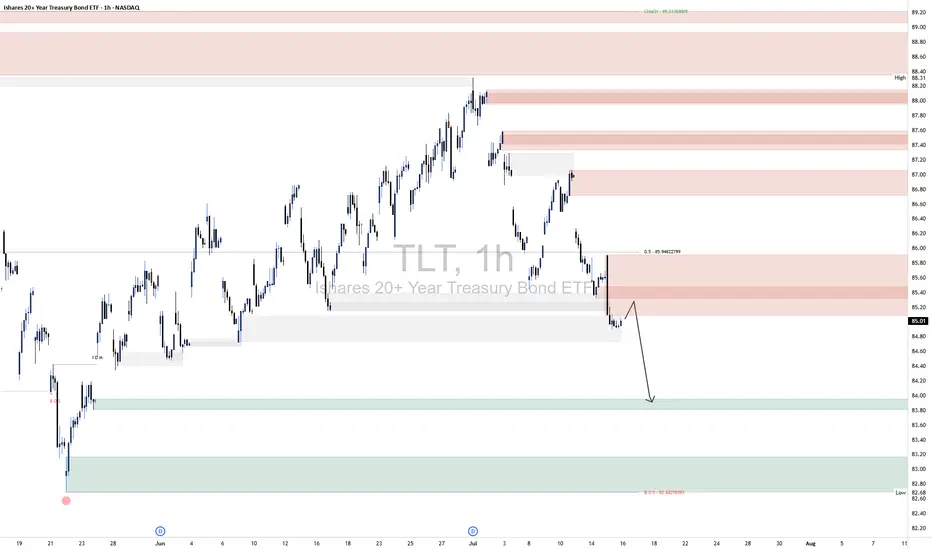
TLT ShortTLT 1H Technical Analysis
📈 Outlook:
The current setup suggests a bearish continuation scenario:
A corrective move toward the 85.20–85.60 supply.
Rejection from this area confirms continuation of the downtrend.
Target: 83.20–83.60, where resting liquidity and untested demand reside.
This seque
Opening (IRA): TLT Sept 19th 83 Short Put... for an .88 credit.
Comments: Camping out with a strike slightly below the 52-week low, where the options contract is paying a smidge more than 1% of the strike price in credit.
I don't really need more TLT, but wouldn't mind being assigned more at a lower price than the stock element of my co

How Will Uncle Sam Strike Back? – U.S. Treasuries on the Edge📉 How Will Uncle Sam Strike Back? – U.S. Treasuries on the Edge
After covering leveraged loans ( BKLN ), junk bonds ( HYG ), and investment-grade corporates ( LQD ), we now focus on the most important piece of the U.S. credit puzzle: Treasuries.
Specifically, the long end of the curve — tracked b

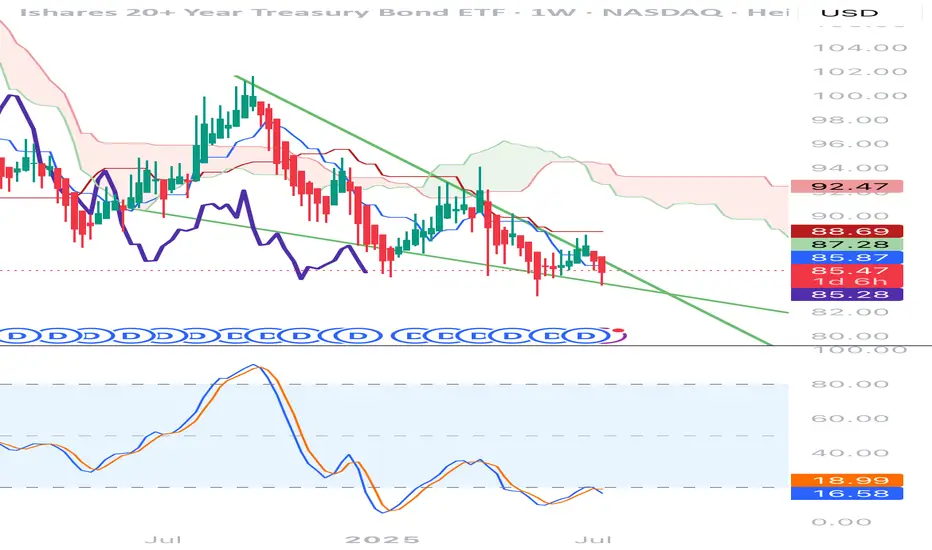
TLT is currently in the Wyckoff accumulation phaseBased on the provided weekly and daily charts for the iShares 20+ Year Treasury Bond ETF (TLT), here is a Wyckoff analysis and a potential trading strategy using a diagonal option spread.
### **Wyckoff Analysis of TLT**
**Weekly Chart:**
The weekly chart for TLT appears to be in the early stages

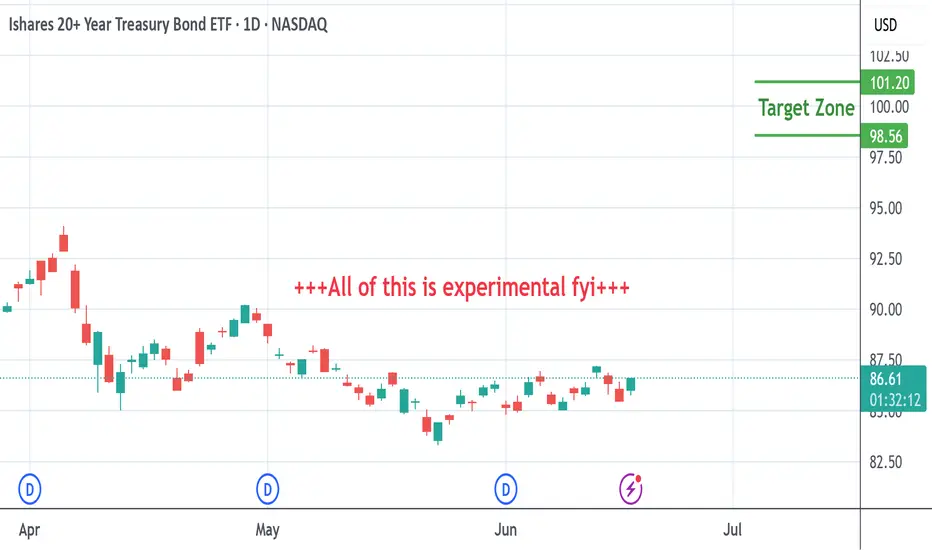
TLT long into Sept. 26th?I had TLT on my calendar (from the very EXPERIMENTAL dowsing work that I do) for yesterday and today from readings I did on 5/22 & 5/18.
Being that it was looking like a swing low in this date window, I checked this morning, & from the very experimental work that I do, I get that it's heading to aro
See all ideas
Summarizing what the indicators are suggesting.
Oscillators
Neutral
SellBuy
Strong sellStrong buy
Strong sellSellNeutralBuyStrong buy
Oscillators
Neutral
SellBuy
Strong sellStrong buy
Strong sellSellNeutralBuyStrong buy
Summary
Neutral
SellBuy
Strong sellStrong buy
Strong sellSellNeutralBuyStrong buy
Summary
Neutral
SellBuy
Strong sellStrong buy
Strong sellSellNeutralBuyStrong buy
Summary
Neutral
SellBuy
Strong sellStrong buy
Strong sellSellNeutralBuyStrong buy
Moving Averages
Neutral
SellBuy
Strong sellStrong buy
Strong sellSellNeutralBuyStrong buy
Moving Averages
Neutral
SellBuy
Strong sellStrong buy
Strong sellSellNeutralBuyStrong buy
Displays a symbol's price movements over previous years to identify recurring trends.
Frequently Asked Questions
An exchange-traded fund (ETF) is a collection of assets (stocks, bonds, commodities, etc.) that track an underlying index and can be bought on an exchange like individual stocks.
TLT trades at 84.75 USD today, its price has fallen −1.88% in the past 24 hours. Track more dynamics on TLT price chart.
TLT net asset value is 86.34 today — it's fallen 0.14% over the past month. NAV represents the total value of the fund's assets less liabilities and serves as a gauge of the fund's performance.
TLT assets under management is 47.47 B USD. AUM is an important metric as it reflects the fund's size and can serve as a gauge of how successful the fund is in attracting investors, which, in its turn, can influence decision-making.
TLT price has fallen by −1.78% over the last month, and its yearly performance shows a −8.19% decrease. See more dynamics on TLT price chart.
NAV returns, another gauge of an ETF dynamics, have fallen by −0.14% over the last month, showed a −2.08% decrease in three-month performance and has decreased by −5.57% in a year.
NAV returns, another gauge of an ETF dynamics, have fallen by −0.14% over the last month, showed a −2.08% decrease in three-month performance and has decreased by −5.57% in a year.
Since ETFs work like an individual stock, they can be bought and sold on exchanges (e.g. NASDAQ, NYSE, EURONEXT). As it happens with stocks, you need to select a brokerage to access trading. Explore our list of available brokers to find the one to help execute your strategies. Don't forget to do your research before getting to trading. Explore ETFs metrics in our ETF screener to find a reliable opportunity.
TLT invests in bonds. See more details in our Analysis section.
TLT expense ratio is 0.15%. It's an important metric for helping traders understand the fund's operating costs relative to assets and how expensive it would be to hold the fund.
No, TLT isn't leveraged, meaning it doesn't use borrowings or financial derivatives to magnify the performance of the underlying assets or index it follows.
In some ways, ETFs are safe investments, but in a broader sense, they're not safer than any other asset, so it's crucial to analyze a fund before investing. But if your research gives a vague answer, you can always refer to technical analysis.
Today, TLT technical analysis shows the strong sell rating and its 1-week rating is sell. Since market conditions are prone to changes, it's worth looking a bit further into the future — according to the 1-month rating TLT shows the strong sell signal. See more of TLT technicals for a more comprehensive analysis.
Today, TLT technical analysis shows the strong sell rating and its 1-week rating is sell. Since market conditions are prone to changes, it's worth looking a bit further into the future — according to the 1-month rating TLT shows the strong sell signal. See more of TLT technicals for a more comprehensive analysis.
Yes, TLT pays dividends to its holders with the dividend yield of 3.87%.
TLT trades at a premium (0.26%).
Premium/discount to NAV expresses the difference between the ETF’s price and its NAV value. A positive percentage indicates a premium, meaning the ETF trades at a higher price than the calculated NAV. Conversely, a negative percentage indicates a discount, suggesting the ETF trades at a lower price than NAV.
Premium/discount to NAV expresses the difference between the ETF’s price and its NAV value. A positive percentage indicates a premium, meaning the ETF trades at a higher price than the calculated NAV. Conversely, a negative percentage indicates a discount, suggesting the ETF trades at a lower price than NAV.
TLT shares are issued by BlackRock, Inc.
TLT follows the US Treasury 20+ Year Index. ETFs usually track some benchmark seeking to replicate its performance and guide asset selection and objectives.
The fund started trading on Jul 22, 2002.
The fund's management style is passive, meaning it's aiming to replicate the performance of the underlying index by holding assets in the same proportions as the index. The goal is to match the index's returns.