TLT ShortTLT is at a very well-defined resistance level and overbought. The MACD is also elevated to the same level where we last saw a steep reversal in the price of TLT.
To short TLT, I suggest the triple inverse ETN of TLT called TMV.
TLT trade ideas

TLT ready to pullback
TLT is forming what looks like a bear flag on daily and getting ready to pullback.

LONG a Falling Interest Rate! - TLTNASDAQ:TLT is an ETF that tracks value of United States Treasury Bonds in the time range of the 20-30-year bonds. With this ETF tracking the bond value it will rise with the decrease in these bond yields as the previous bonds offering higher % rates increase in value.
I am bullish on TLT for a few reasons that are summarized in the bullets below
- Interest Rates are at their highest levels in around 20 years and history would show that following these peaks in the 5.5%-7% range tends to be a sharp fall of interest rates usually due to a general moderate or severe economic downturn needing economic stimulus with low rates
- Along with the peak thesis, in the current economic state of America, it has been generally discussed by Fed Presidents that rate slowdown / rate hike pauses are starting. The FedWatch tool from CMEGroup shows that traders predict the highest rates will not go any higher, and actually start being cut in Early Spring 2024. Due to this data, it is definitely important to realize the risk/reward of this trade on how the downside is minimal with the current economic conditions proving interest rates will likely not move higher, and definitely not more than a last 25bps hike for this rate cycle considering no unprecedented events occur.
- Another staple to this bullish thesis is against the Federal Reserve. I strongly believe the Federal Reserve bluffs intentionally during their public conferences and talks. Recalling the inflationary period following COVID, the Fed repeatedly spoke out on this inflation being transitory while CPI rocketed to record highs in decades. I believe they like to not inform the public to the 100% truth and locked room talks. The Fed has came out and said they are quite against publicizing a rate pause officially / begin cutting rates and I believe this is a bluff. As the Fed claims to wait for data, I believe that data is showing, and will continue to show stronger economic struggle from the effects on high-interest rates. As unemployment just ticked up and probably will continue, rates will start to drop fast as soon as the Fed starts. Treasury Yields would likely dump prior to all of this as the anticipation begins to flow into the markets. Lastly, I think the Fed tends to deceive the public to try and not heavily move the markets in a short time.
- Overall the data should start to pour in on economic slow down as student loan repayments resume, credit delinquencies continue to rise, housing market cools, unemployment ticking up, and more can feed to a sharp drop in CPI as aggregate US demand settles.
The Fed will act on this slowdown and will need to sharply cut interest rates, especially if they wait too long.
- Technicals on NASDAQ:TLT also look strong with a major demand zone, a dailydouble bottom and a diagonal trendline supports the price level. TTM_Squeeze also backs up a possible end to the downside. Below 89 area could be a solid Exit area for risk-management.
Any Cut in Rates, or anticipation in rate cuts can send TLT flying with bond yields tumbling.
Bonus: NASDAQ:TLT also provides a safe hedge to a market collapse or recession. Because market recessions would spark a cut in rates to help fuel a recovery, while stocks may tumble, this ETF would rally on a decline of interest rates to help stimulate a falling economy.
Thesis : long Commons or 2025 dated Credit Spreads

$TLT Resistance at $100 PivotNASDAQ:TLT Resistance at $100 Pivot, Friday December 15, 2023 NY Fed President Williams stated on CNBC, "We aren't really talking about rate cuts right now." This seemed to conflict with Jerome Powell's post-meeting press conference. It does not matter what they say it will show up in the charts and our algorithms.

Watch TLT Support at Multi-Decade LowsPrimary Chart : Monthly Chart of TLT Showing Multi-Decade Support Levels.
A fair amount of charts have been published lately on the importance of interest rates, and conversely, long-term bonds, government or high-yield bonds. One well-known TradingView publisher @scheplick went so far as to describe the chart of the US 10-year yield as the most important chart for understanding financial markets in this season. His post was entitled, " The Most Important Chart in the World :
TLT is an iShares ETF that tracks the performance, generally speaking of long-term US Treasury bonds. Specifically, iShares describes TLT as an ETF that "seeks to track the investment results of an index composed of U.S. Treasury bonds with remaining maturities greater than twenty years."
TLT has been in a severe downtrend since March 2020. Bonds yields move inversely to price, and TLT represents, in a rough sense, the price of an index or basket of long-term US government bonds with maturities greater than 20 years. So if long-term bonds remain in a downtrend, then this corresponds to the uptrend in long-term yields that has continued to break higher than anyone expects.
The Primary Chart shows TLT having reached long-term, major support at 2009-2010 lows. But a careful examination of TLT's recent lows reveals that it broke slightly below those lows, which isn't a good look for bond bulls in the long term. Supplementary Chart A shows 2009-2010 lows on a monthly chart (similar to the Primary Chart above).
Supplementary Chart A
However, TLT's reaching such a major support level, with a lower wick forming (at least initially), could imply a move higher in bonds and a concomitant move lower in yields in the near term. But remember that fighting a predominant trend (mean reversion) when it becomes extended can be one of the trades having the lowest success rate. But it can also have a higher reward rate if risk is managed well. SquishTrade does not recommend being long bonds here but rather commenting on how traders may react to major support levels in TLT's downtrend. They may be right or wrong—recall that no one likely expected long bonds to fall as far as they have, and many have been positioned long bonds since TLT was in the upper $90s!
The next few supplementary charts emphasize the nature and severity of the downtrend in long-term bonds, as represented here by TLT. The first shows TLT's 200-day simple moving average (SMA). Price is about –12.11% below the 200-day SMA as of mid-session on Friday, September 29/
Supplementary Chart B
Next, the VWAP anchored to TLT's long-term cycle high is shown in black. This confirms a long-term, and extreme downtrend in long duration US Treasury bonds. Long-term VWAPs do not always have such a noticeable downward slope. Even a bounce to $125 could present just a mean reversion (retracement) within this downtrend despite creating an uptrend on the daily or even weekly chart, which would be necessary to reach that distant level.
Supplementary Chart C
A Fibonacci channel below has been applied to a weekly TLT chart. Notice how the channel shows support right where the weekly lower wick formed—the 1.618 level of the channel. To be sure, this does not necessitate a long-term trend reversal (though anything is possible, and this could be the spot). But it does suggest the potential for a near term bounce in the shorter cycles.
Supplementary Chart D
Anyone wondering whether a long-term uptrend is still in place from the start of TLT's price history should consider the following chart. This shows decisive breaks of several long-term (and progressively accelerating) uptrends.
Supplementary Chart E
Year-end flows can be supportive of equities, though not always—note the late 2019 exception for CBOE:SPX and $NASDAQ:NDX. If some relief materializes in long-term to intermediate-term bonds, then this could coincide with some support in broader equity markets into year end, though this is by no means guaranteed.
Consider the following posts and charts on yield curve inversions posted by @SPY_Master and this author on TradingView:
These charts of yield-curve inversions should give one serious concerns about the near-term (3 months to 2 years) health of the stock market.
This post is in no way advocating any particular investing or trading strategy. Short-term trading and long-term investing can both be either devastating or profitable (or somewhere in between those extremes) to the person engaging in it.
And thanks for reading this and for your encouragement and support.
________________________________________
Author's Comment: Thank you for reviewing this post and considering its charts and analysis. The author welcomes comments, discussion and debate (respectfully presented) in the comment section. Shared charts are especially helpful to support any opposing or alternative view. This article is intended to present an unbiased, technical view of the security or tradable risk asset discussed.
Please note further that this technical-analysis viewpoint is short-term in nature. This is not a trade recommendation but a technical-analysis overview and commentary with levels to watch for the near term. This technical-analysis viewpoint could change at a moment's notice should price move beyond a level of invalidation. Further, proper risk-management techniques are vital to trading success. And countertrend or mean-reversion trading, e.g., trading a rally in a bear market, is lower probability and is tricky and challenging even for the most experienced traders.
DISCLAIMER: This post contains commentary published solely for educational and informational purposes. This post's content (and any content available through links in this post) and its views do not constitute financial advice or an investment or trading recommendation, and they do not account for readers' personal financial circumstances, or their investing or trading objectives, time frame, and risk tolerance. Readers should perform their own due diligence, and consult a qualified financial adviser or other investment / financial professional before entering any trade, investment or other transaction.

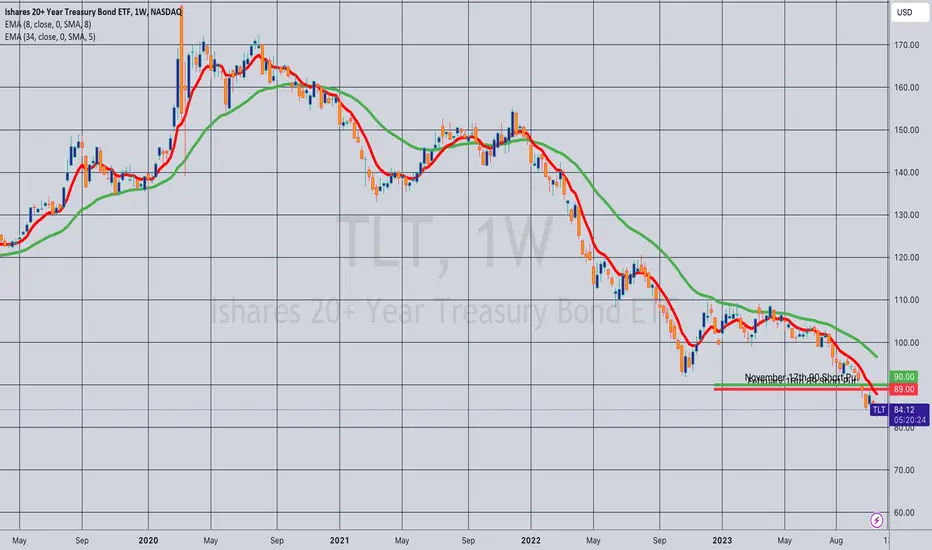
Rolling (IRA): TLT Nov 17th 90 to Feb 16th 89 Short Put... for a .42 credit.
Comments: Down ... and out. Originally collected .95 (See Post Below); with the .42 here, 1.37 total.
Rolling (IRA): TLT Nov 17th 92 to March 15th 92 Short Put... for a .97 credit.
Comments: Alas, this could not be meaningfully strike improved, so just rolling it out as is. The deeper the in-the-money it is, the farther out in time you have to go to get paid something decent ... . Collected .79 originally (See Post Below) plus the .97 here for a total of 1.76.

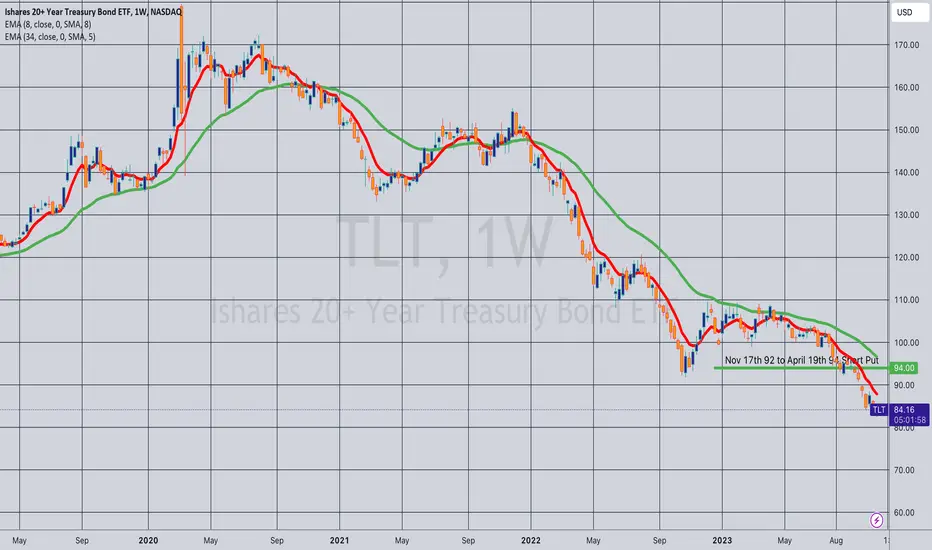
Rolling (IRA): TLT Nov 17th 94 to April 19th 94 Short Put... for an .85 credit.
Comments: Another that can't be meaningfully strike improved without paying a debit ... . Collected .75 originally (See Post Below). With the .85 here, 1.60 total.
And that ... ends the November contract housekeeping portion of our show. Unfortunately, I'll probably have to do some more of this in the December contract (ugh).
Rolling (IRA): TLT December 15th 94 to Feb 16th 93... for a .33 credit.
Comments: Rolling down and out ... . Originally collected .89 for the 94 (See Post Below). With the credit received for the roll, I've collected a total of 1.22.

Rolling (IRA): TLT December 15th 91 to Jan 19th 90 Short Put... for a .26 credit.
Comments: I could let this ride, but would rather be assigned at a lower strike (if it comes to that). Collected .86 for the 91 (See Post Below). Another .26 here results in 1.08 collected.

TLT Core Position (IRA)In the absence of some kind of face-ripping rally, I'm going to be assigned shares in TLT here shortly, starting with what began as an October 20th 93 short put and an October 20th 89 short put. Here, I'm using short puts as an acquisitional tool, attempting to acquire shares in multi-year weakness, after which I'll proceed to cover the shares with short calls. The short call premium, along with TLT's monthly dividend, will result in positive cash flow.
There are a couple of different approaches I could utilize here to manage the shares I'm assigned, one of which is to sell a call against each individual lot I'm assigned, laddering out short calls in time as I'm assigned shares. Since I've got quite a few contracts subject to assignment, this would result in sort of a covered call spaghetti-works.
Another simpler approach would be to see what the average cost basis of all the lots I'm assigned is, and then proceed to sell calls at or above that average cost basis in a single expiry. For example, the average cost basis of the two rungs shown here is (89 + 93)/2 or 91/share. With that cost basis in mind, I would proceed to sell two calls at or above the 91 strike at a reasonably delta'd strike in an expiry that's paying. Given the distance price has pulled away from my likely average cost basis, the calls are likely to be somewhat long dated.
Given the fact that my highest short put strike is at 94, I'm more likely to sell calls at 94 initially, wait to be assigned everything that I'm going to get assigned, look at the average cost basis at that point and then adjust the short calls accordingly. Because of its simplicity, this is the approach I'll be going with, looking to stay in the shares and manage the entire position on a fairly long-term basis.
As usual, we'll see how it goes ... .

a fairly bullish candleBullish candle for gold, silver, platinum, copper etc
Bullish candle for gold, silver, platinum, copper etc

$TLT EXTREMELY BULLISH The 20 year treasury hit a strong monthly support. I believe that the Federal Reserve cut rates sometime in 2024, if this happens this will shoot TLT to match ATH. Investors have priced in the Fed to cut rates in march but I believe it will be later on in the year.

$TLT bottom. Upside ahead targeting $100+As I wrote in my last post on TLT, I had a target of $88. $88 was hit on Friday and is now slightly below it today.
I went long both via spot and calls. I took March 15 2024 calls at a $101 strike price and I'm anticipating a large move higher playing out by then.
I've marked off resistance levels on the chart. Let's see how it plays out over the coming months.
I'm not a believer in the rates are going to stay higher for longer narrative. I do think they'll be higher than where we were in 2021, but I do not think they'll stay at 5+%. I think the financial system will end up being in trouble and the only out will be to bring down rates again. I do think that'll play out sometime in the next 6 months.

TLT Decade LowTLT has been a popular short trade as the Fed has committed to raising rates throughout 2022-2023 and causing pain in markets. Today, we are starting to approach some extremely critical support zones towards the 2008 recession price point.
I have been considering 2 buy in zones at $88 and potentially a capitulation to $82 (if it even gets that low).
We are still waiting to hear from Powell in regards to further rate hikes, and the market is currently expecting one more hike with no real major cuts for 2024.
I will be looking out for the following statement during the next FOMC:
Powell decides to raise one more time according to the Dot Plot, however state that the comity has reached their goal of sufficiently restrictive territory with no more further rate hikes.
However, he will be adamant that rates will remain higher for longer, and the Fed will monitor live data to make future decisions.
This may be the mark of the bottom for TLT where I will start accumulating.

TLT: Support and resistanceTLT looks very terrible, guess what may be it's time to jump in.
It is going down from last two years, we are at the levels we have not seen in decades.
Looks bullish as of now, but long term(2 to 3years) for sure bullish.
Happy investing.
Cheers.

Long TLTAdding to TLT here as rates likely will get cut sometime soon, which is being priced into the ETF as we speak.
$120 price target from here to be hit in mid/end of 2024.

Opening (IRA): TLT December 29th 91 Short Put... for a .92 credit.
Comments: Laddering out, targeting the 16 delta strike wherever that lies in the expiry.
I may keep laddering out into 2024 on the notion that the Fed cuts rates at some future and currently unknown point in time, but liquidity in these tends to break down as you go further out in time ... .

Opening (IRA): TLT December 29th 90 Short Put... for a 1.20 credit.
Comments: Adding a rung out in the Dec 29th expiry at a strike better than what I currently have on.
Since I'm in an acquisitional frame of mind with TLT, I'm pretty much going to run with these until they're approaching worthless (i.e., <.05). If I get assigned, I'll proceed to sell call against.

Is this unfinished running flat 4th wave rally? 4/12/2023
Recent upward movements in TLT Treasuries have sparked considerations regarding the Federal Reserve's stance on interest rates. While there is a prevailing belief that the Fed has concluded its tightening cycle, indications suggest otherwise. Our analysis suggests that the current trend may represent a counter-trend rally, likely persisting until the commencement of the upcoming year.
This observation prompts us to speculate that both traditional market indices and cryptocurrencies may experience further upward momentum, contingent upon critical levels. Employing straightforward Fibonacci tools allows us to pinpoint key levels for monitoring and analyze subsequent market reactions.
The environment of diminishing volatility and the consolidation of price action may contribute to an appreciation of asset values into the initial stages of the coming year. However, it remains crucial to observe potential developments of rising divergences, potentially signaling a market reversal and subsequent sell-off in the latter half of 2024.
This nuanced analysis underscores the importance of closely monitoring market dynamics, key levels, and potential divergences, ensuring a comprehensive understanding of the evolving financial landscape.
Estonian :Viimased muudatused TLT riigivõlakirjades on tekitanud juttu selle üle, kuidas Föderaalreserv suhtub intressimääradesse. Kuigi paljud arvavad, et Fed on intressimääradega juba lõpetanud, näitavad meie uurimused, et olukord võib olla keerulisem. Hetkel tõus võib olla vastutuule ralli, mis kestab tõenäoliselt kuni järgmise aasta alguseni.
Selline olukord viitab võimalikele võimalustele nii tavalistes turuindeksites kui ka krüptoraha turul, olenevalt olulistest tasemetest. Lihtsate Fibonacci tööriistade abil üritame tuvastada olulisi tasemeid, mida jälgida, et mõista ja analüüsida, kuidas turg reageerib.
Praegune keskkond, kus volatiilsus väheneb ja hinnad käituvad ühtlaselt, võib tähendada, et vara väärtused tõusevad järgmise aasta alguses. Samas on oluline hoida silma peal muutuvatel mustritel, eriti tõusvatel erinevustel, mis võivad viidata turu pöördele ja müügilainele 2024. aasta teisel poolel.
See analüüs mitte ainult ei aita meil mõista hetke turusuundumusi, vaid näitab ka meie valmisolekut teadliku ja ettenägeliku investeerimisstrateegia poole liikumiseks. Järgides neid suundumusi, hoiame kindlat pilku olulistel tasemetel ja võimalikel erinevustel, et meie investeerimisplaan oleks hästi läbimõeldud.

TLT bullish With a bullish divergence on the weekly timeframe and bouncing off the early 2000’s lows, sets the ground to go for the108 resistance but now until 92.26 becomes the local support.. remember, the economy is not the market.

Rolling (IRA): TLT November 3rd 88 Short Put to January 19th 87... for a .42 credit.
Comments: Received an .88 credit for the 88 (See Post Below); rolling it down and out for a .42 credit. Total credits collected of 1.30.
If I'm going to get assigned, lower is naturally better, even if it's only a strike ... .

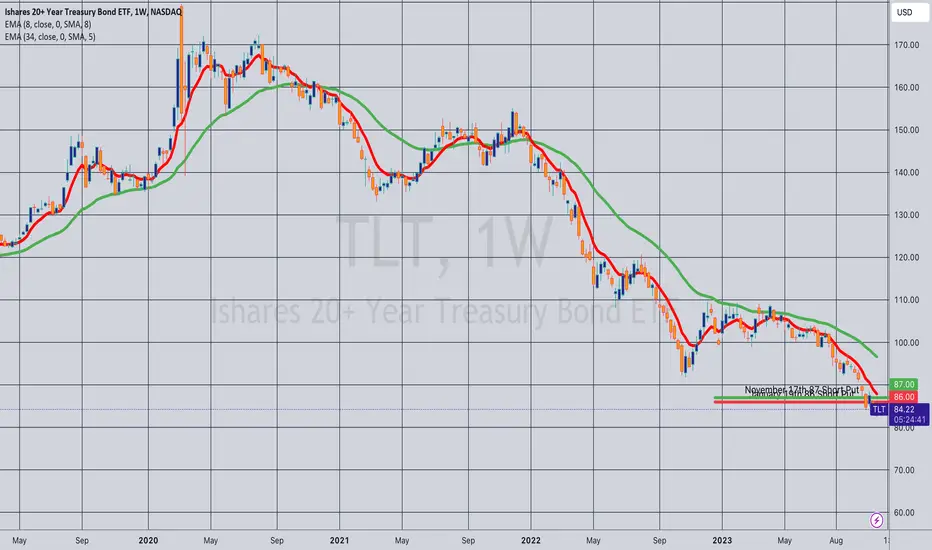
Rolling (IRA): TLT Nov 17th 87 to Jan 19th 86 Short Put... for a .65 credit.
Comments: Down a smidge and out. .76 collected originally. (See Post Below). With the .65 collected for the roll, 1.41 total.