TLT - Lemmon / Royer 714Quaaludes.
Stumble Cookies as we used to refer to them.
Half a dozen in a pitcher of Beer and it was down
to the ground.
Ah, the good old days, when Mommy's suffering from
manic depression we're Sub'd these little ones.
__________________________________________________
Bond Vigilantes might be suffering from Sopor Ingestion.
If so, please - the hookup.
__________________________________________________
The Degen Class of 007s has never quite learned the game.
Rip it up, move down
Rip it up, move it down to the ground
Rip it up, cool down
Rip it up, don't hang me on the borderline
On the edge of oblivion
And all the world is Babylon
And all the love and everyone
A ship of fools sailing on
(Wang Chung )
___________________________________________________
No matter we'll continue to take their Bacon and eat their
Cake. Everything is better bacon-wrapped.
Even Cake.
Sweet and Sour.
____________________________________________________
After dismal 13 / 26 week auctions.... 2's and 5's sheet the bed as well...
7's had a rough day... less than 50% uptake on JunkCo Gov Bongs.
Savage X Fenty, we're surmising.
_____________________________________________________
Our favorite Velociraptor is back... toothless and starving ever so
slowly. Wondering why the Dolt O' Whirl is imploding again.
Looking for a "Massive RT!"
A quick review of Dino's revisionist Track Record who was Wildy
Hog Calling 180 for TLT and buying every Dip...
T-r-X
∙
Sep 9, 2021
Wrong boy is wrong.
T-r-X
∙
Sep 10, 2021
@HK_L61, US treasuries are still cheap.
T-r-X
∙
Sep 14, 2021
@HK_L61, TLT is actually AAA quality government bonds (not junk).
Btw JP Morgan is a large buyer of US treasuries.
"Jamie Dimon says he wouldn't touch Treasurys with a 10-foot pole at these rates." Just do the opposite.
I will enjoy seeing you lose money.
T-r-X
∙
Sep 15, 2021
∙
TradingView for Android
I allocate between SPY, TLT and cash (DXY). I don't use options.
T-r-X
∙
Nov 9, 2021
How's your short going?
T-r-X
∙
Dec 29, 2021
@jscheurichiv, JP Morgan wants them.
T-r-X
∙
May 12
@HK_L61, Still convinced in my 30 year US treasuries position. 30 year yield will drop to around 1%.
T-r-X
∙
Jan 19
∙
TradingView for Android
@HK_L61 Nothing changed. Your calls were all wrong.
________________________________________________________________
Losers lose, Winners Win - T-REX Wrecked.
TY for your $.
xoxo - Hunter Killer
TLT trade ideas

Can 10-Year Notes (TLT) Recover From This Sell-Off?My answer is most likely. Technically we will see 110.96 hold (GREEN) and make a push higher above 111.26 & 111.72.
Fundamentally, it's likely we have peaked in terms of inflation. Many measures suggest that is the case and sentiment is skewed towards being too bearish on Notes/rates. Certainly a contrarian play, but not just for the sake of being contrarian.

TLT - RT into further CollaspeHow the Fed manages another slug of $20B in 10 Year purchases... it won't last.
Every flight to safety has been met with one outcome.
Wreckage.
We began TLT ZN ZB Sells @ 2% Friday.
Scale up, Scale in for round 2 of eating the Dinosaurs.

TLT bottoms in weekly hammer & divergence;but 108 still possibleTLT may have already bottomed out & the US10Y topped out with weekly hammer candles. TLT may find equilibrium at 132, my inflation pivot zone while US10Y may stabilize at 3.6% inflection point retesting its upchannel.
TLT is now completing its M-pattern & has just entered my bullish BUY ZONE at 114 to 120. DCA Dollar cost averaging up from this point presents a very good risk-to-reward ratio.
MORE DOWNSIDE? TLT may still go down to retest 108 where it bottomed multiple times in the past.
Inflation expectations are slowing & the economy is starting to contract with oil & commodities turning down last week with investors pricing in a coming recession.
Not trading advice.

RSI trendline crossover indicates bottom for TLTThe bullish RSI trendline crossover is indicating a bottom for 20+ year U.S. government bonds. I expect the stock market to follow bonds in the rally to higher prices.

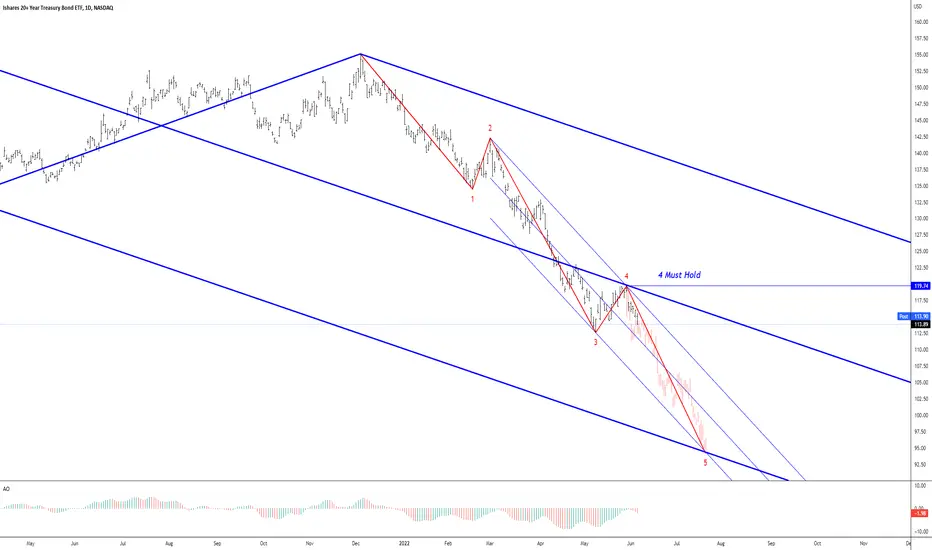
TLT - 3 Down 1.618 or 2.618Complete Wreckage.
Eddie Munster and Crew swing missed and
the bat came around, knocking them out.
It's over Bond Queens.
An amazing representation of Failure, is TLT.
Junk & Co remains Junk.

TLT iShares 20 plus year treasury bond ETF nasdaq: tlt iShares 20 Plus Year Treasury Bond ETF Review
NASDAQ: TLT
They have at their disposal the trend since 2007 as well as a key support zone.
Thank you for your support, greetings.
L.E.D in Spain as of 06/21/2022

Takuri Line : reversal sign.Alright, interesting candle on the one week on TLT :
In my opinion this is a Takuri Line. The body is small and the close happens near the high (I am not 100% satisfied with this classification since it has an upper shadow but it is 16% of overall candle). The lower shadow is more than three times the body length (3.37). So it fits the takuri line definition.
It happens at an extreme low - lowest point in over 120 weeks - which would also be a good environment for the Takuri line to appear. It is statistically a solid reversal candle.
If we gap up tomorrow and finish above 116 in the next three weeks we could be setting a new up trend that leads us to 132 - 133.... (we couled retest 108)
IT IS VERY BULLSIH - I know. I think macro factors favor a more bullish bias...
we'll see.
Good luck.

$TLT a longer term long position Looking at the trends on TLT I believe we are at the bottom. I have set some rough targets based on the trends, previous resistance and fibs.

TLT Pivotal Equality Test UnderwayIn this update we review the recent price action in TLT and identify the next high probability trading pattern and price objectives to target

TLT ReboundFollowing TLT -
I looked at the candlestick formation on the monthly chart and given historicl statistics we apparently have a little bit over 50% chance of a reversal of the downward trend we have experienced so far. If this is the case, we could see $126 over the next 4 weeks based on my calculations.
I would be interested to see if you have the same views.

TLT - Another Month of Wreckage 7/7 Due007s who bought the dip...
Ripped.
It's now a comedy and further evidence...
Throwing Capital into a toxic cesspool does not produce
a Hulk, Spiderman, or Marvel Character who defies the laws
of common sense.
Buy this Chart and LOSE.

SPY, BONDS & FED BALANCE-SHEET - (zoomed)A place to view T-Yields, Fed Funds, and Money Supply against TLT and the SP500 .

SPY, BONDS & FED BALANCE-SHEETA place to view T-Yields, Fed Funds, and Money Supply against TLT and the SP500.

$TLT ~ Lower lows as expected...We was looking for a 5th wave and it appears we are getting it. Once 61.8 is reached, will need to monitor to see if it holds or we continue pushing lower to the 78.6. Seems there are few safe assets these days as liquidity is drying up.

TLT dangerously close to 2008 supportNASDAQ:TLT not looking to HOT here. The federal reserve has the following 3 options:
1) Stick to 0.50 basis points and continue the slow bleed. ~ This will piss off investors with cash on the sidelines and will most like hit the market harder.
2) Get aggressive and raise 0.75-1 basis point ~ Market may react positively. This would show the federal reserve is "serious" on fighting inflation.
3) Take the foot off the accelerator and step back into the market. Using macro environment as an excuse, for example Russia invasion of Ukraine and China lockdowns.
I think it is noteworthy to mention that China has lowered their interest rates and are outperforming US equities. It honestly looks way more attractive and this is something the fed will have to ponder. This is a lose/lose battle because the federal reserve cannot magically print supply.

pop, pop, fizz, fizz-- no more yield curve inversioni think this is headed for a terminal thrust or wave 5, and abc will correct on some support in the given lower ranges TLT. after seein all time highs, i believe the 10 year will fade if it enters weekly consolidation, and fails some break out level forming a false breakout of upper 90% range. TLT is on watch for bullish divergence macd, stoch, rsi monthly

Long TLT at 116.03www.tradingview.com
At a strong support level, buying TLT with a larger position of 5% here for all of the reasons circled in my chart, as well as the fundamentals that made the technicals possible.
Seeing what happened following the great financial crisis, 2016 and during covid in 2020, we can see a major run up in the TLT. Expecting the same over the medium term.
Also, RSI and MACD levels show support for buying.

Will Superman (Powell) Return" No maybe in 2023Well well well here we are again now that your fake heroes have finally given up on calling inflation transitory which even a a circus monkey to tell you that wasn't going to happen we Can begin with the bloodbath. Well not here necessarily that will begin with the S&P 500 it will make sense soon enough. I will start with my condolences for those retirees with their 60/30 getting hammered both ways for those doing good keep it going baby. The boys at FED just started removing money from the markets this the beginning of more quantitative tightening measures to come. Anyone believing that this can hold if it goes to 130 it's just pure fractional wrongness while we are oversold The FED is no longer buying therefore no reason for this to make a turnaround we have been on a downturn since March 9th 2020 and people would rather risk money on the market than to buy these bonds even if the S&P were to capitulate to 3500 YES I know 600 points that's what happens when markets are flooded with cheap money. My best case scenario is bonds go 5-8% up I have a range of put options with expiration's in August September and some in January 2023. But I'm a cheapskate so I'm waiting for those puts to get a little cheap its in my best interest to do so.
(Remember money is made when people refuse to think that bad things can happen and they WILL This is just the beginning BABY)

$TLT ~ Expecting one more leg down then ready to run...Expecting bonds to push one more time lower as shown to complete its wave 5. Once complete may be a very interesting opportunity.

TLT Plot.Made a short idea recently with the expectation the bounce was going to be a bit higher (and that's still possible) but it's looking more like this bounce may of topped and we're going head down from here.
Traditional portfolio strategy for retirement... not so hot now!The candles below represent a 60/40 mix of TLT and SPY, bonds and stocks. SPY (orange) and TLT (blue) by comparison show than neither asset class is helping to overcome the bad performance of the other. By comparison, moving money to cash (UUP) looks like it would have been a great short-term move against inflation.

Bear Flag in Bond ETF?Bonds have been in a steady downtrend all year. And now, after a period of consolidation, the iShares 20+ Year Treasury Bond ETF may be set to continue lower.
This main pattern on this chart is the modest rebound over the last three weeks. Given the preceding four months of downside, it could be a classic bearish flag. The current drop also represents a potential break of the flag, which could bring sellers from the sidelines.
Second, notice how the stochastic oscillator recently jumped to its most overbought reading of the year.
Third is the low price of $111.90 from late 2018. Will traders look for that level as support?
Finally, macro conditions may favor downside in TLT. Yesterday brought strong U.S. consumer confidence and higher European inflation. Today featured robust manufacturing data. Non-farm payrolls are due Friday, followed by CPI on June 10 and the Federal Reserve meeting on June 15.
TradeStation has, for decades, advanced the trading industry, providing access to stocks, options, futures and cryptocurrencies. See our Overview for more.
Important Information
TradeStation Securities, Inc., TradeStation Crypto, Inc., and TradeStation Technologies, Inc. are each wholly owned subsidiaries of TradeStation Group, Inc., all operating, and providing products and services, under the TradeStation brand and trademark. You Can Trade, Inc. is also a wholly owned subsidiary of TradeStation Group, Inc., operating under its own brand and trademarks. TradeStation Crypto, Inc. offers to self-directed investors and traders cryptocurrency brokerage services. It is neither licensed with the SEC or the CFTC nor is it a Member of NFA. When applying for, or purchasing, accounts, subscriptions, products, and services, it is important that you know which company you will be dealing with. Please click here for further important information explaining what this means.
This content is for informational and educational purposes only. This is not a recommendation regarding any investment or investment strategy. Any opinions expressed herein are those of the author and do not represent the views or opinions of TradeStation or any of its affiliates.
Investing involves risks. Past performance, whether actual or indicated by historical tests of strategies, is no guarantee of future performance or success. There is a possibility that you may sustain a loss equal to or greater than your entire investment regardless of which asset class you trade (equities, options, futures, or digital assets); therefore, you should not invest or risk money that you cannot afford to lose. Before trading any asset class, first read the relevant risk disclosure statements on the Important Documents page, found here: www.tradestation.com .
