TLT - The Madness of Mass Delusions10Yr Yields declined as international Capital Flows began demanding dollars out of the fear as to what is occurring outside the USSA.
This implies, as well, a robust demand for perceived "Safety" - the very last thing it actually is.
Europe, as we have indicated for months now, remains a basket case.
For as bad as it is here, it's worse there.
However, this is short term in its duration as the USSA is losing favor as a "Partner" of actual substance.
The Long Con remains in trade.
It will get a lot worse outside the USA which remains bullish on capital inflows.
Simply watch France as they are teetering on another Bastille Moment.
_____________________________________________________________________________________________________________
That said, the objective of the Level Pullers is not friendly.
Sending hoards of cash into the Fed Reverse Repurchase Market - reduces the cash in the Banks. This ONLY accelerates the liquidity crisis, which, in the very short term can have an important effect on Yields.
It is temporary.
Christine LaGarde, has been inferring that a policy shift is taking place which will be a transition in 2022. Stimulus policies have totally failed and the negative interest rates have destroyed the European Bond Market. Inflows to USTs is axiomatic for the EU, for the UK... not so much as they have shown a clear and present desire to position to China's Bond Market... slowly.
The ECB's ONLY tool remaining is the rather hurried rush to digital currency ASAP for Europe is out of time.
It will not go over well and lead to immense Social unrest.
France, Ireland, Spain, Greece, Italy won't simply roll-over.
80 Central Banks around the Globe desire digital currencies according Lagarde - "We think that it's a duty of us to actually have available digital currencies that would operate to the benefit of consumers."
There is nothing the governments ever do that is for the benefit of consumer citizens unless it benefits the Government 1st.
LaGarde intends to end Private Cryptocurrencies.
In her own words - "funny business" in Crypto needs to end, once and for all.
They will be regulated out of business... plan for it.
When you replace "Currency" which comes into existence from DEBT, Governments no longer need DEBT MARKETS
aka Bonds.
Currency no longer exists, Unlimited Pokemon Cards do however.
The ability of the ECB to continue buying endless debt from its member states is coming to an end.
Pressures to break up the EU is growing and this above all is driving the ECB to take drastic actions.
They will cancel the Euro ahead of schedule, sending the FX Markets into a tailspin.
_____________________________________________________________________________________________________________
UST Bond HODLers somehow believe this works well for them... it can in the very short term.
Ultimately, the Tide begins to approach our shores as Confidence itself evaporates.
The game of borrowing forever with no intention of paying anything back is coming to an end
and with it the US Bond Markets.
What will be the Value of your Bonds?
They will become "Perpetual" - you will be allowed, permitted and forced to accept a coupon
with no return of principal, that will be in Lock Down for good.
Any/All protest from the SVM / Bong Community will have to provide critical rebuttal of the above
for any further consideration.
Unintelligent Echo is considered amorphous, Vapid, Delusional, Degeneracy and participation in its
own demise.
We are no longer entertaining idiocy.
- Hunter Killer
TLT trade ideas

$TLT - Bond volatility low and ripeNow that Fed chiefs are selling their stocks near all time highs they can now start tapering quantitative easing and we could see bond market volatility pick up from current depressed levels.. 20 Year Treasury Bond ETF $TLT has a 52wk IVR of 3.47% and another way to insulate your long term portfolio from more volatility is to buy a straddle on bond volatility.. we’re looking at the NOV’19 ATM $148 straddle for a debit of $6.63.. and close for 50% profit or loss of premium, whichever comes first..

TLT - SVM Fanbois scratching ItchesWe enjoy cock sure Bond Bag Holders, there answer to everything is BUY.
It's wrong as you all will discover.
We call it - "The Everything Must Go Sale"
Don't worry kiddos, it's temporary
Chasing it is a mistake.
xoxo - Hunter Killer

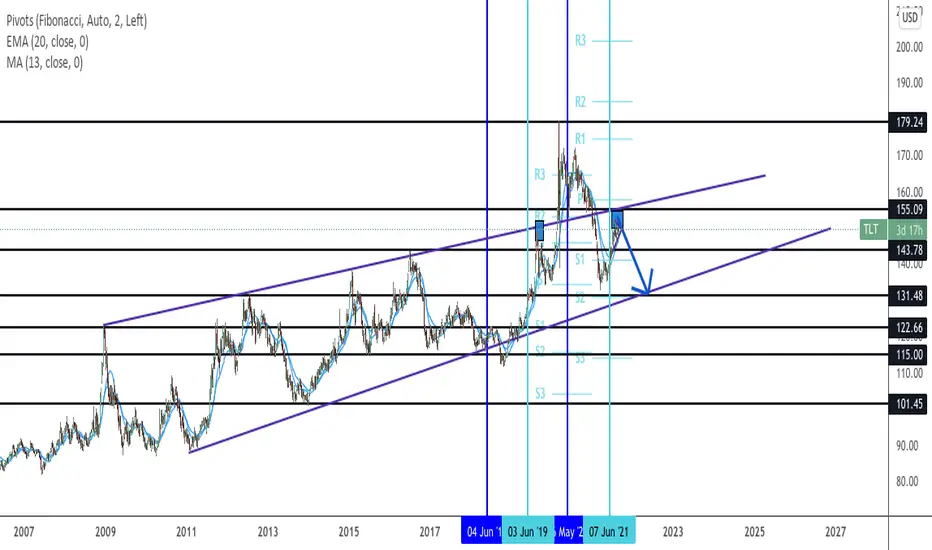
$TLT another wave down ???An updated review on TLT - it has been going sideways for the last 2 months and where is it going ?
My forecast is - downside has a higher probability.
Wave 1 took about 224 days down and the retracement up to 50% took 124 days.
This seems like the perfect setup for a short. Michael Burry also predicted the crash of TLT.
lets see how this pans out.

TLT - Large Dump Ahead for 20YrTLT is rolling over.
Steve Van Metre Fanbois FANBOIS being led to slaughter.
Watch the DX.
FX accident ahead.

Short TLTBonds showing a symmetrical triangle, with stochastic RSI and MACD showing downside pressure, along with strong trendline resistance.

TLTThe direction of the breakout of the blue triangle will probably be a big deal for, well, everything.


Bounce off resistance will send tlt down to retest bottom. Retest of bottom is likely on this price action chart.
Bullish TLTTrendlines : All downtrend lines that can be drawn from $172.25 and below have been broken. Last downtrend line drawn above and has been broken as well.
Support/Resistance : $153.16-$154.63 is a possible resistance zone that could pause this rally however, given the rallying dollar and narrative of economic slowdown, we could certainly retest $172.25.
Moving Averages : new uptrend line confluence with the 50 SMA. Above all major MA’s: EMA 9, SMA 20, 50, 100, 200.
Bullish unless new uptrend line/50 MA breaks.

Strong Bearish Signal on TLTWe have a strong indication that BlueWave is going to give a Red Dot Sell signal soon, and it can be confirmed with the Stochastic RSI.
We also know that Micheal Burry from the big short movie is shorting TLT.
Adding to that SPY is close to its peak. So be careful.

TLT - Longer End 10/20/30 FlatteningSince 2002 when GSCO's Timothy Bitsberger's began his reign as Assistant Secretary of the Treasury.
Fiscal Fundings began to move down the curve to under 30 Months and accumulate a large concentration
within this timeframe.
It placed the burden of Government Finance up on the Short End of the Yield Curve near the region of control
for the Federal Reserve and their ability to drive Monetary Policy.
During the waning decades to today, the Bond Markets have become 11.2X the size of Equities.
Since 2008 we have witnessed a rapid acceleration in Money Stock, one which remains underreported then
(as the FED ceased reporting M2) to today where the very life blood of Credit Growth Velocity has dried up
and reversed.
TARP, TALF and the Yield Swaps accumulated $32 Trillion in Debt. 91% of the American Public was against these
Monetary Measure then.... Today they Gag for it as the Global Economy lays in ruin. Independent Producers have
been wrecked to the point, recovery is simply not viable.
The FED Minutes served to provide several references to moving up the Timeline for Tapering.
This provides cover for Powell's (we'll let ya know while we're thinking about thinking) as behind the scenes
they are preparing for short duration reduction in the usual suspects - RMBS, CDO, CDO, Corp Debt, Zombie
DEBT.
Yield Curve Controls became evident as the 1.71 10Yr yield was not permitted to be breached, had it and
Swaps would have been grossly offsides and created a large dislocation.
At present, The uncertainty over the impact of this Policy change - Potential Policy change - remain in Flux.
The Dollar, our target is 9465 ST, remains the wild card as the EU faces retribution for decades of abuse and
a failed attempt at Negative Interest Rates - the vote of Confidence ALWAYS flows to the Currency of Seniorege,
the US DOLLAR.
Capital Flows favor US Markets as China is making it extraordinarily clear, they are closing off the Monetary &
Economic Borders well in advance of the UNWIND coming to our shores.
A steepening or inverting yield Curve is immaterial. We crossed the Rubicon long, long ago.
As we witness the SPX to M2 Stock overthrow the .22 level - there is an important message there, extremely
important, which is why we suggested the ES would attempt an over-throw on Friday @ the 4441 level.
These actions ahead of Jackson Hole are significant.
More to follow within the 5 Part thesis beginning with ES/M2S, TLT, Divergences, Capital Flows and "Resurrections'
Trade"
HK


TLTTLT shows whether smart investors believe the stock market will perform well in the next few months to few years. TLT downtrend shows investors are moving funds to stocks, showing bullish for stocks. TLT uptrend shows investors believe stocks will be falling, so they buy into TLT instead.

TLT vs DJTTLT vs DJT divergence forming for past few months. DJT usually acts as leading indicator to economic slowdowns. TLT usually acts as leading indicator to market tops. Right now both and showing a leading indicator towards possible slowdown and market top, how will it affect the extended bull run moving on?

Investors are more Risk Averse : TLT vs HYGTLT/HYG - RiskOff vs. RiskOn: Tells you how risky investors/lenders are...
The Chart presented maps the performance of TLT (risk off) vs. HYG (risk on). It is evident that there is currently a risk off move occurring in the markets. When TLT outperforms HYG, this is bearish for equites. On the chart, I inputted vertical lines on the periods where TLT outperforms HYG. When this occurs it usually spells a short term peak in the markets.
TLT is a measure for the safest form of credit: 10Y US Treasury Bills. The yield on these bills is known as the "risk free rate". Investors looking for a risk averse strategy will put their money in here and gather a humble return. However, when investors are looking to get paid more for the money they are loaning; they look for High Yielding Grade credit otherwise known as, Junk Bonds. This debt has higher risks of default but, are more profitable.
Credit is what makes America great. People/corporations spend, spend, spend borrowed money which, leads to more people having more money in their bank accounts. As lenders becoming more risk averse they lend less and are more prudent with their money. Lenders will gravitate to safer investments that do not risk default. After all, when you borrow; you borrow from your future self.

TLT - 150 Puts now Active - ZN 134s STO / ZB 16490 STOsTLT Gap Fill was the Fill.
150 Put entry completed on GF.
November 150s now solidly in profit
for this trade, B/E is stop as VX enters
and true range appears at 2:45PM EST.
This is an aggressive SELL on TLT for us.
We believe TLT ends up being Sold Hard.
ZN/ZB tend to lead these declines. The Setups
in both ZN & ZB are complete.
We hold large positions in both:
ZN @ 134.00 x 25
ZB @ 164.90 @ 25
Our largest and ONLY Position outside of AMC SELLs.
We believe this trade will see 3% at minimum, it will be
very quick and very dirty as ROCs expand.
Bond Curve >/= 10yr in confirmed SELL.


tltprevious discussed tlt going to $182 from the area we've just hit
change of plans. i think we go to $157 from here to put in this last sub-wave 5 into wave (1) before the retracement into wave (2) on the higher degree ($141 area).
once that wave (2) is in, i whole heartedly expect a seriously impulsive move to the $180 area which should shake up the markets really nicely.
tltr;
subwave 5 target = $157
previous tlt posts leading up to this:

TLT Patterns repeatExpecting yields to rise Monday then back down for a week or two.
Bought some TLT puts. If things go as expected, then we get a bear trap Monday as the market (at least tech) will do a small gap down.

Consumer Sentiment: Uh Oh.This morning, the UMCSI printed a 70.2, which is the worst number since March of last year and, prior to that, the end of 2011. If you were wondering why TLT is up 1.4% today, and XLP is crushing, while XLY and XLF are getting hurt, it's because a slowdown in consumer sentiment is REALLY bad for inflation expectations and retail spending. This further plays into the deflationary trends that have been winning the recent fight in treasuries, and explains why tech seems unconcerned. Consumer Staples is strong off of the back of relative valuation.
If you're not paying attention, this one reading was simple to miss, but we think it's going to be driving market sentiment over the next few weeks. Fundamental sentiment appears to be shifting from a GDP point of view, and we are much less bullish on equities as a whole than we were 4 hours ago.
Cheers!

TLT Bouncing Off 0.382 FibFib retracement analysis
TLT bounced off 0.5 and broke 0.382.
Today, it is hitting the 0.382 fib resistance.
Expecting it to come back down to 0.236

$TLT touching on support MA50TLT has just touched on the ma50 line @145.71 which is also the top on June 18.
With gold out of favour and USD going up, the smart money is pouring into the treasury bond. this is a good time to collect some bond for the next 1-2 years.
Interest rate should stay low for the mean time and equities should be hot for the coming year.
