$TSLA either one big flag or massive short setting upHello,
Just some browsing, NASDAQ:TSLA hasn’t had any major moves prior to early May - June IMO. This is on my watch for a short swing setup. This is bull flagging but I see a short here. I’m conflicted. I do see the higher low but we are in a pitchfork and this has been consolidating in this $290-$340 area for about a month and half. There’s also a lower high. Just posting for some free dialogue and open ideas. Talk to me. Let me know what you see and think. We aren’t too far from 200EMA and 200SMA. It’s just curling above the 50 as well. Maybe we consolidate for another week or two? A massive move is brewing here I think. I’m talking $100 in a week up or down soon.
WSL
TSLA trade ideas
TSLA: 305.30
This idea is supported by entry price and institutional rebound.
Strong institutional breakout. Bullish Entry 2 — Institutional breakout + momentum.
Entrada: 310.00/317.00
SL: 308.00
TP1: 314.00
TP2: 316.00
Bearish Entry 2 — Strong institutional breakout
Entry: 300.00
SL: 302.00
TP1: 296.00
TP2: 292.00
TSLA, revenue decline/textbook technical setup.TSLA, revenue decline/textbook technical setup.
Confluence of major levels, how to take a well defined short trade with puts.
Clean as it gets.
Tesla's Bullish Momentum Builds Ahead of EarningsCurrent Price: $329.65
Direction: LONG
Targets:
- T1 = $333.90
- T2 = $351.80
Stop Levels:
- S1 = $322.70
- S2 = $312.05
**Wisdom of Professional Traders:**
This analysis synthesizes insights from thousands of professional traders and market experts, leveraging collective intelligence to identify high-probability trade setups. The wisdom of crowds principle suggests that aggregated market perspectives from experienced professionals often outperform individual forecasts, reducing cognitive biases and highlighting consensus opportunities in Tesla.
**Key Insights:**
Tesla remains on a bullish trajectory supported by critical technical signals, including a golden cross—a strong indicator of upward momentum. The company's strategic focus on artificial intelligence and autonomous driving is fueling long-term enthusiasm among investors. However, macroeconomic risks, including rising competition from Chinese EV manufacturers, require careful monitoring. Tesla's upcoming earnings report is widely anticipated as a key event likely to influence short-term price movements, with a potential for heightened volatility.
Tesla's ability to innovate and adapt to highly competitive EV markets makes it a central player within the "MAGA7" stocks, where technology companies dominate market trends and sentiment. A combination of strategic moves in AI, energy, and automotive autonomy creates strong bullish undercurrents.
**Recent Performance:**
Tesla has seen consistent upward momentum in recent sessions, buoyed by optimism over production numbers and product launches. Its share price recently benefited from renewed sentiment in the consumer discretionary sector, positioning Tesla as a market leader. While its recent gains have reinforced long-term investor confidence, the stock remains vulnerable to volatility ahead of the upcoming earnings announcement.
**Expert Analysis:**
Analysts are optimistic about Tesla's prospects based on several tailwinds, including its first-to-market edge in full self-driving (FSD) technology and its expected rollout of the affordable Model Q. While improving gross margins remain a focus, competition in China poses a near-term challenge. Historically, Tesla's shares have shown considerable movement following earnings, with realized volatility averaging 10.2% compared to implied volatility of around 6.3%. Current technical indicators, such as rising moving averages, bolster the bullish case.
**News Impact:**
Recent headlines surrounding Tesla's robo-taxi fleet ambitions and accelerated AI developments have positioned the company as a leader in future technologies. Meanwhile, regulatory advancements, including possible approval of its FSD system in China, could unlock significant revenue streams in the Asian market. However, policy concerns regarding EV tax credits and ongoing macroeconomic uncertainties introduce downside risks.
**Trading Recommendation:**
Tesla offers an attractive long opportunity given its robust technical setup and multiple near-term catalysts, including its imminent earnings report and innovations in AI and autonomy. Anchored at $329.65, the stock is expected to test $333.90 as the first resistance level, with a stretch target of $351.80. Maintain disciplined risk management with stop levels at $322.70 and $312.05, as macro headwinds and earnings volatility remain potential risks to the bullish outlook.

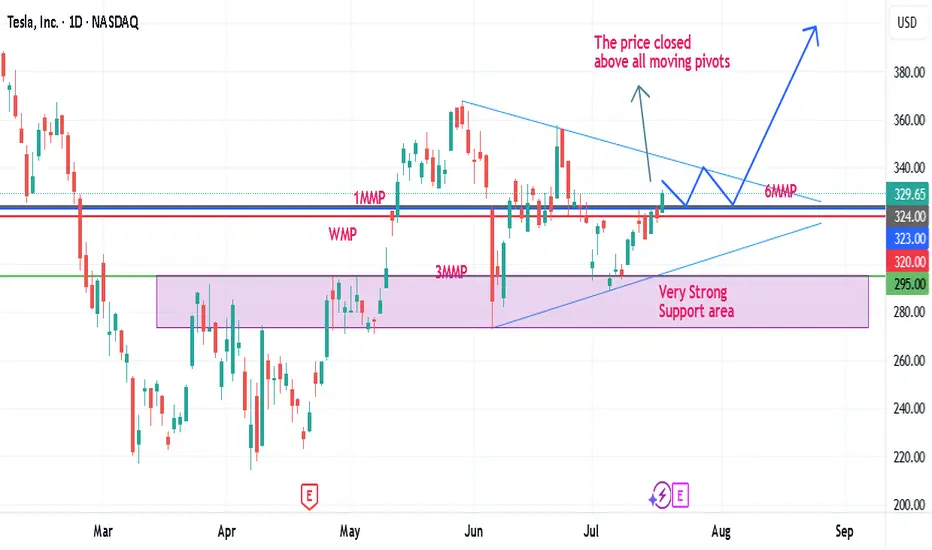
TESLA IS COMPLETELY READY TO SKYROCKET TOWARDS 400$-HERE IS WHYDear traders, based on the daily chart, the price experienced a very important daily as well as weekly close above all its moving pivots, i.e., weekly, monthly, 3 months and 6 months. Besides the price is well above all of its important moving averages supporting by positive 9D, 14D, 20D, 50D and 100D macds as well. These all confirm a great potential for a massive move towards 400$ and beyond in coming days/weeks. The support area is well established between 280-300$ and this area will hold the price for a decisive upward movement. Let's See!
TESLA SELL PLAN – BEWARE BUYERS, FUEL IS BELOW📉 TESLA SELL PLAN – BEWARE BUYERS, FUEL IS BELOW
🔻 Market Structure:
Recent bullish push retraced into a bearish fair value gap (FVG), indicating potential exhaustion in buying.
🟥 Supply Zone Hit:
Price revisited the FVG zone and faced rejection twice, showing sellers are active at that level.
👁️ Liquidity Eyes:
Two major liquidity pools are clearly marked below – price may seek these resting liquidity areas.
🔻 Bias:
Bearish, as price reacted from premium FVG and is forming lower highs.
📍 Execution Plan:
Monitor for continuation patterns on lower timeframe within context.
Ideal short entries can be found after confirmation rejections from FVG zone.
Expect internal liquidity sweeps before the major drop.
🎯 Target:
Watch for price to draw down toward the external liquidity zones below, especially near previous macro demand areas.
⚠️ Note for Buyers:
Current retracement is likely corrective. Until price breaks structure and invalidates the bearish FVG, upside is risky.

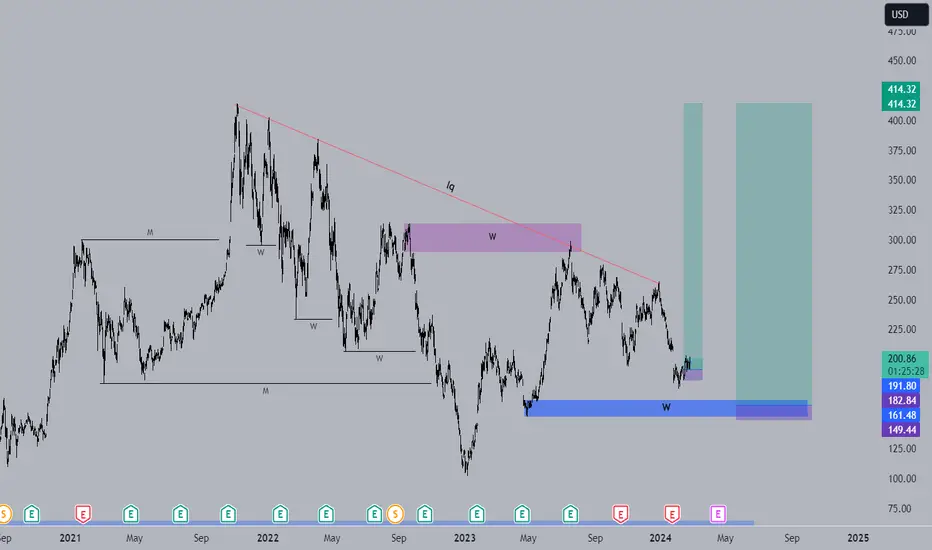
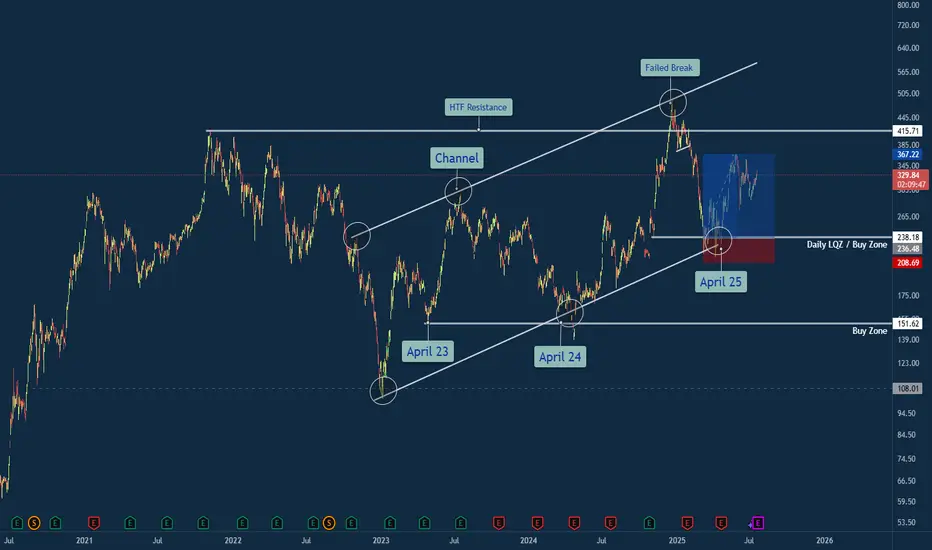
Tesla Trade Breakdown: The Power of Structure, Liquidity & ...🔍 Why This Trade Was Taken
🔹 Channel Structure + Liquidity Trap
Price rejected from a long-standing higher time frame resistance channel, making a false breakout above $500 — a classic sign of exhaustion. What followed was a sharp retracement into the lower bounds of the macro channel, aligning with my Daily LQZ (Liquidity Zone).
🔹 Buy Zone Confidence: April 25
I mapped the April 25th liquidity grab as a high-probability reversal date, especially with price landing in a confluence of:
Demand Zone
Trendline Support (from April 23 & April 24 anchor points)
Volume spike + reclaim of structure
🔹 Risk/Reward Favored Asymmetry
With a clear invalidation below $208 and targets at prior supply around $330+, the R:R on this trade was ideal (over 3:1 potential).
Lessons Reinforced
🎯 Structure Always Tells a Story: The macro channel held strong — even after a failed breakout attempt.
💧 Liquidity Zones Matter: Price gravitated toward where stops live — and then reversed sharply.
🧘♂️ Patience Beats Precision: The best trades don’t chase. They wait. This was one of them.
💬 Your Turn
How did you play TSLA this year? Were you watching the same channel? Drop your insights or charts below — let’s compare notes 👇
#TSLA #Tesla #SwingTrade #PriceAction #LiquidityZone #FailedBreakout #TechnicalAnalysis #TradingView #TradeRecap #ChannelSupport #SmartMoney
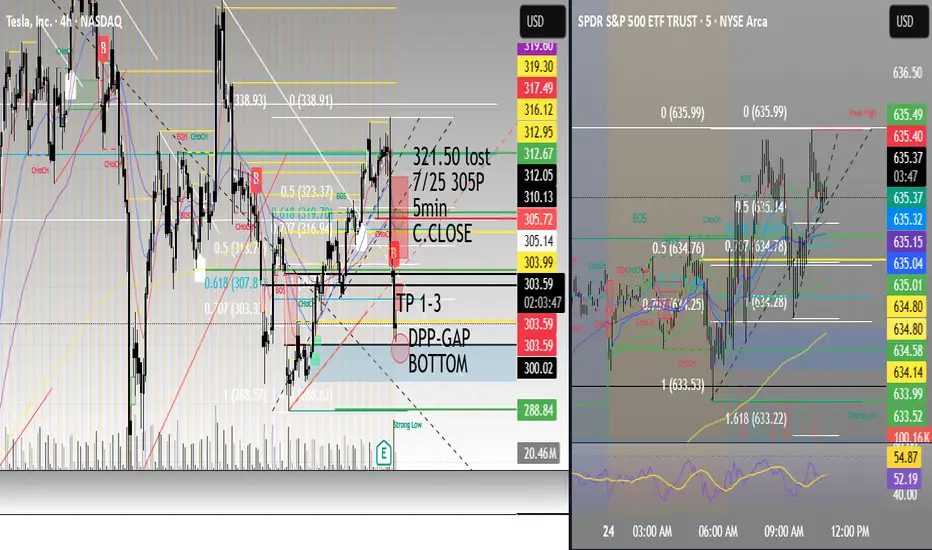
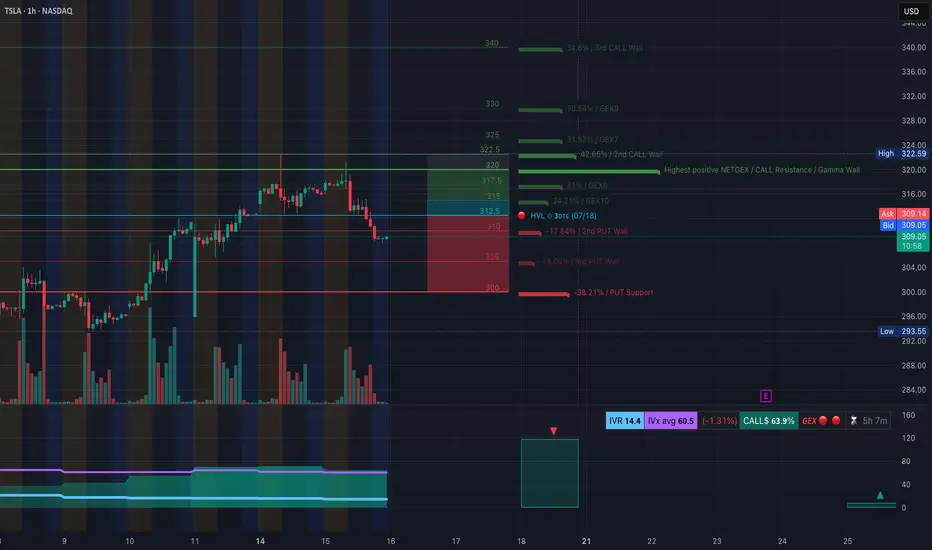
TSLA at a Turning Point. Gamma Flip + Price Breakdown? TAJuly 16🔍 GEX Analysis (Options Sentiment)
* Key Call Walls (Resistance):
* $322.5: +42.65% GEX — Major resistance and 2nd Call Wall
* $325 / $330: More overhead call resistance
* $317.5: Minor resistance
* Gamma Flip Zone (Highest Net GEX / Resistance):
* Around $320–322.5, price is likely to face supply pressure from dealers hedging short calls.
* PUT Walls (Support):
* $305: 2nd PUT Wall (−17.84% GEX)
* $300: PUT Support (−38.21% GEX)
* HVL (High Volume Level):
* $312.5: High-volume strike for this week’s expiration – significant battleground.
* IVR/Flow:
* IVR is 14.4 – low implied volatility.
* Call bias dominates: Calls 63.9% vs Puts.
* GEX sentiment = 🟥 Bearish leaning.
💡 Options Strategy Based on GEX
* Bearish Play:
* Buy 305P or 300P for short-term swing into the gamma void.
* Best risk:reward as dealers are likely to unwind positive gamma, accelerating downside toward PUT walls.
* Neutral-to-Bearish Strategy:
* Bear Call Spread around $317.5–$322.5 (above HVL, inside call wall congestion).
* Expect price rejection below $317.5 if no reclaim happens.
* Avoid CALLs unless price reclaims and holds above $317.5 with strong volume and momentum shift.
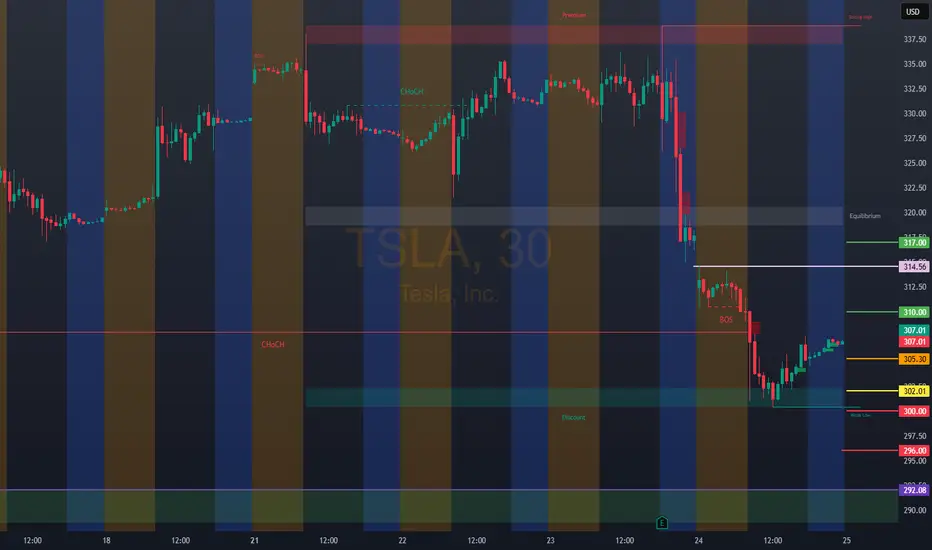
📈 1-Hour Chart Technical Analysis
* Structure:
* Bearish CHoCH and confirmed Break of Structure (BOS) below $310.
* Price dropped from the upper OB and failed retest confirms supply zone around $317–$321.
* Trendlines:
* Descending wedge forming with lower highs and current support at $307.97 and $305.
* Watch for bounce-to-fail retests at $312.5 or breakdown continuation.
* Zones to Watch:
* Bearish Order Block (OB): $316–$321 (purple zone) = Sell zone.
* Demand/Support Zone: $293–$296 (green box) – likely bounce zone.
📌 Trade Scenarios
* Bearish Intraday Trade Setup:
* Entry: Below $309 or retest rejection from $312.5
* Target: $305 → $300
* Stop: Above $313 or OB invalidation at $317.5
* Bullish Counterplay (Only if confirmed):
* Entry: Hold above $317.5
* Target: $322.5 → $325
* Stop: Break below $315
🎯 Final Thoughts
TSLA looks weak and in distribution after sweeping local highs. The current GEX map favors bearish continuation, and the 1H BOS confirms breakdown structure. Unless $317.5 is reclaimed, bears have the upper hand.
Disclaimer: This analysis is for educational purposes only and not financial advice. Always do your own research and manage risk before trading.
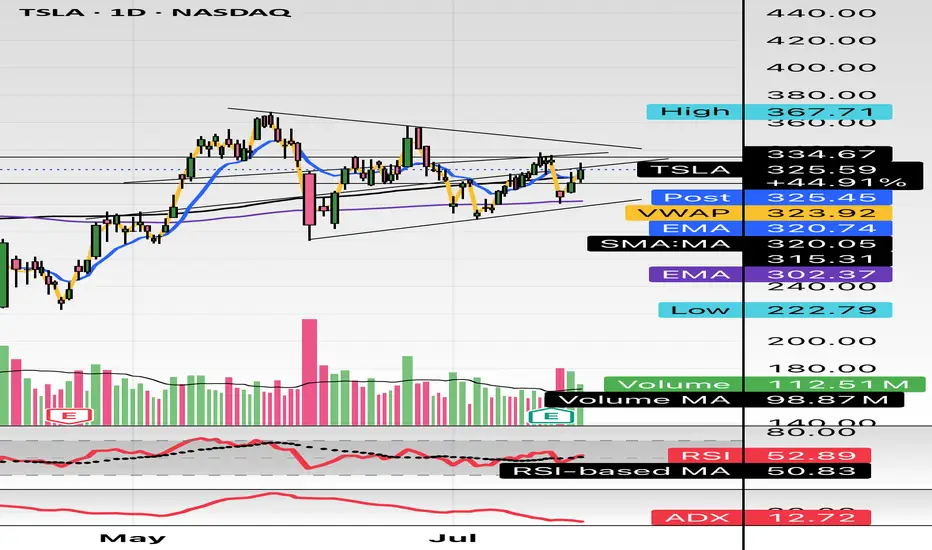
Tesla 1H chart showing room for a 10% upside - Bullish setup This Tesla 1H chart showcases a falling wedge breakout with strong volume support, followed by a steady uptrend. The price has respected a rising support line, with a clean re-entry zone and a defined stoploss for trade protection. As long as the price holds above the trendline, the chart remains bullish with a target around $357.
"Tesla 1H chart showing room for a 10% upside — bullish setup unfolding."

TSLA ULLISH JULY 18 2025Tsla is lloling extremely bullish technically. If it stops me out ,il exit but my my targets from here would be $390.
Always put a SL & decide a target before your entry

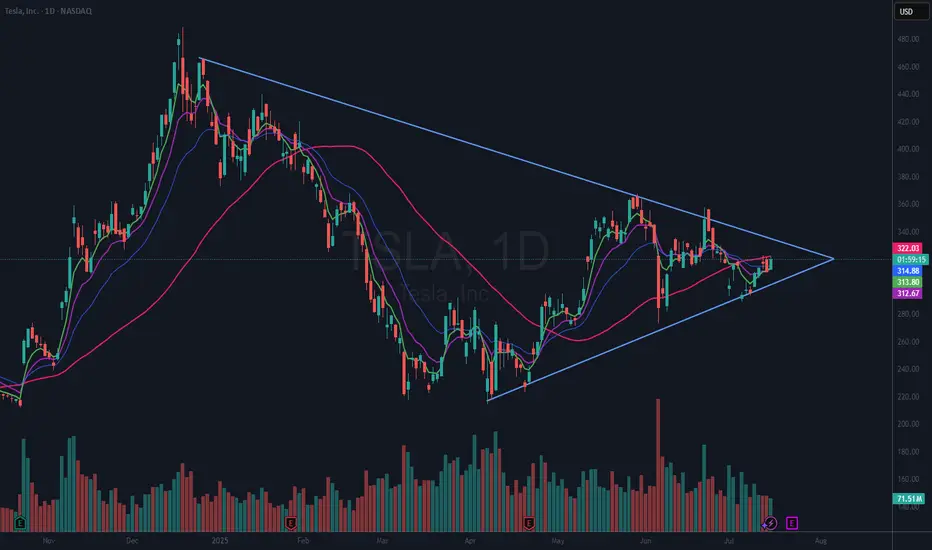
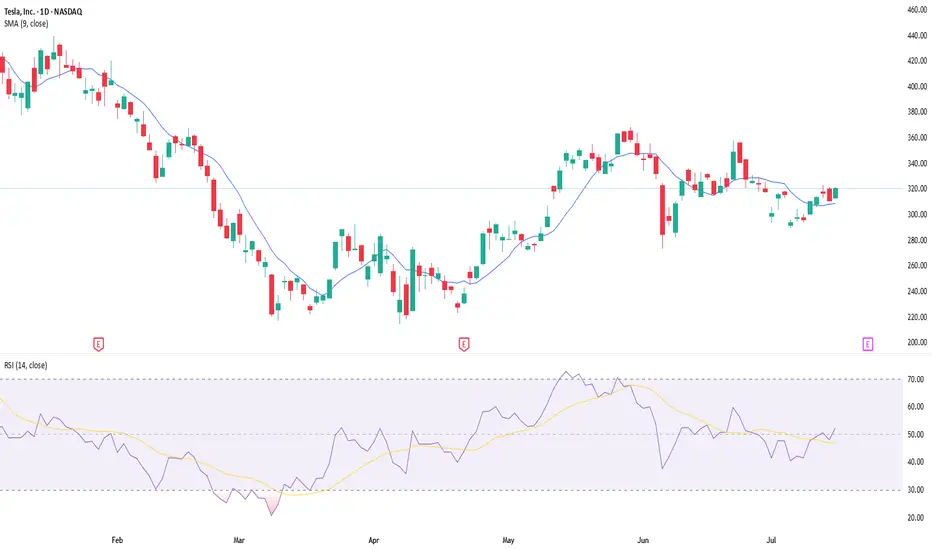
$TSLA Giant Wedging Pattern (VCP)NASDAQ:TSLA is in a giant 7 month wedging pattern. It can be seen as a VCP (Volatility Contraction Pattern) as well. These types of patterns can break either way. However, in this case we have a rising 50 DMA (red). That suggests to me that this will break to the upside.
I already have a small position in TSLA and I will look to add if or when it breaks above the 50 DMA and again if or when it breaks above the upper downtrend line. If it breaks the lower line, I am out.
Be aware that Tesla reports earnings in 7 days, Wednesday, July 23rd, after the bell.
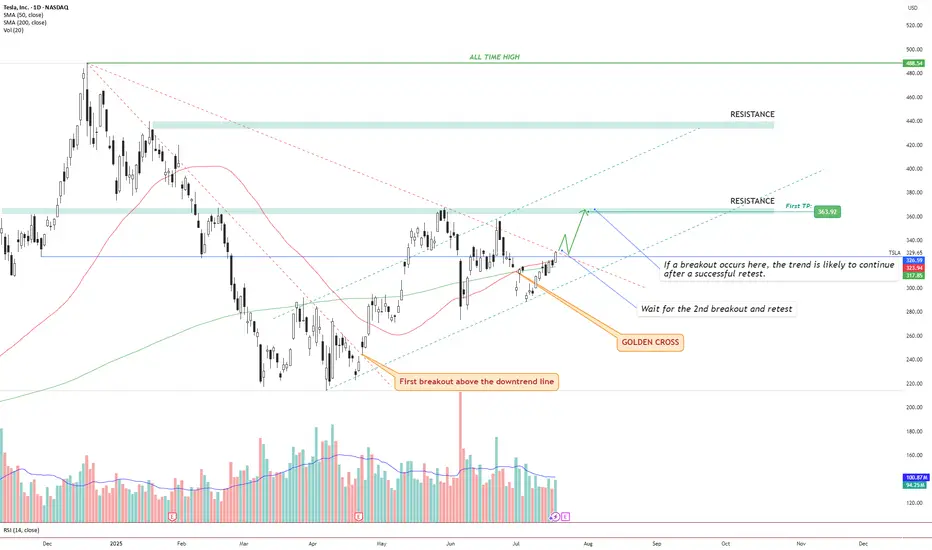
TSLA – Golden Cross + Dual Breakout Structure Targeting $363 andIdea Text:
Tesla NASDAQ:TSLA has recently printed a powerful Golden Cross , where the 50 SMA has crossed above the 200 SMA — signaling a potential long-term bullish shift in trend.
But price action shows more:
We’re observing a dual-breakout structure, where the first breakout above the long-term downtrend line has already occurred (see orange label), and the price is now approaching a critical horizontal resistance zone.
Let’s break it down step-by-step:
🔸 Step 1: Golden Cross
The 50 SMA crossed above 200 SMA — a classic signal for trend reversal. This often attracts institutional interest, especially if followed by breakout confirmation.
🔸 Step 2: First Breakout (Already Confirmed)
Price broke above the descending trendline, retested it, and maintained higher structure. This breakout initiated a shift in market sentiment from bearish to neutral-bullish.
🔸 Step 3: Second Breakout (Setup Forming)
Price is now testing horizontal resistance around $330–$335 zone. This zone also coincides with dynamic resistance from prior failed swing attempts. A successful breakout above this level, followed by a clean retest, can serve as confirmation for a bullish continuation.
🔸 Step 4: Target Setting
🎯 First TP is set at $363.92, a well-defined resistance level. If the breakout holds, next potential targets may develop around key zones such as $395 and $440, depending on price strength and continuation.
🔸 Risk Management
✅ Ideal entry after retest of breakout above ~$335.
❌ Stop-loss below the breakout level or below 50 SMA (~$315 area), depending on entry style.
🔄 Monitor volume: breakout without volume = weak move.
Conclusion:
We are watching a classic price action + moving average confluence setup. Golden Cross, breakout + retest structure, clean resistance level, and defined targets all align.
This setup is valid only with confirmation. No breakout = no trade.
⚠️ Not financial advice. DYOR.
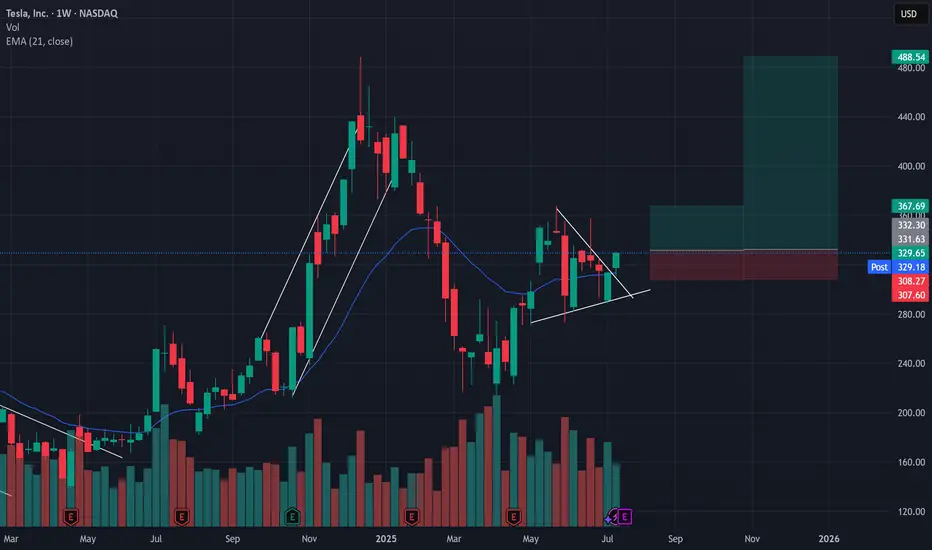
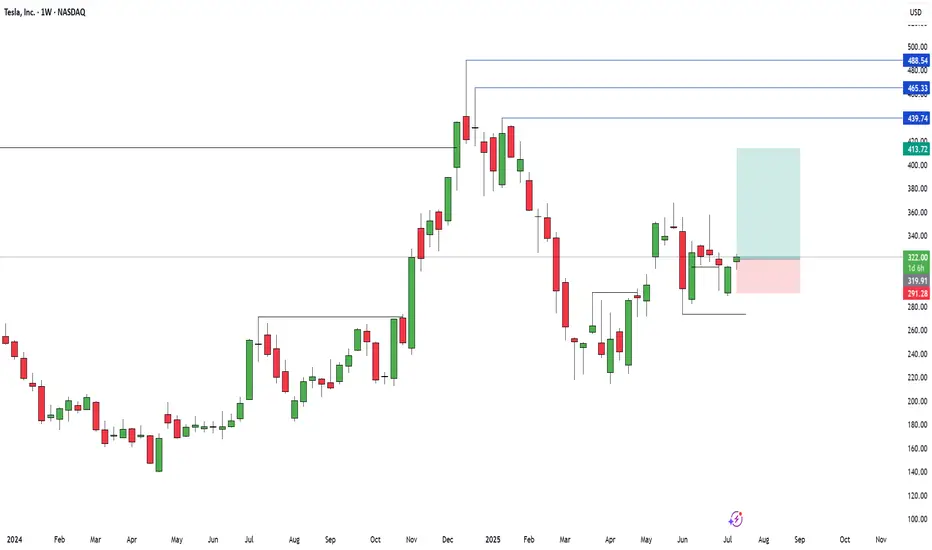
Retested Wedge Bullish Breakout = New Highs?
NASDAQ:TSLA
NASDAQ:TSLL
Tesla has currently showcased two very bullish setups with one already taking place.
Over the past 2 month we've seen TSLA swing dramatically from a high of $368 to a low of $278 while producing lower highs and higher lows AKA a wedge formation.
Wedge formations are a low probability set up and typically produce a 50/50 breakout, however there are a couple of bullish signals on the weekly chart that have kept me in my TSLL position expecting a retest of either the $368 high and/or $490.
Bullish insights -
1 - After a strong push above the 21d EMA, TSLA had a 2 legged pull back with last week being a short failure and closing above the 21d EMA
2 - this week's candle retested the breakout trendline and closed in a very bullish candle.
3 - Tesla's $488 high was an overshoot which produced a strong breakout to the low end, however there was no new high formed meaning there is a high probability chance that we will revisit ~$500.
Trade set up Idea:
If next week's candle forms higher than this weeks bullish candle, target is $368, Stop loss is set at $306 for a 1:1.5 Risk vs reward.
Or
If next week's candle forms higher than this weeks bullish candle, target is $348, Stop loss is set at $306 for a 1:6.5 Risk vs reward.
I'm holding for the second one ;)
Current position - 7400 shares of TSLL
TSLA WEEKLY TRADE IDEA – JULY 21, 2025
🚀 TSLA WEEKLY TRADE IDEA – JULY 21, 2025 🚀
🔔 Bullish Play, But Handle With Caution 🔔
Models split, but momentum wins (for now)…
⸻
📈 Trade Setup
🟢 Call Option – Strike: $332.50
📆 Expiry: July 25, 2025 (Weekly)
💰 Entry: $11.05
🎯 Target: $22.11 (100% Gain)
🛑 Stop: $5.53 (50% Loss)
🕰️ Entry Time: Monday Open
📊 Confidence: 65% (Moderate)
⸻
🧠 Why This Trade?
✅ RSI trending bullish on both daily + weekly
⚠️ Weak volume & bearish options flow (C/P ratio > 1)
📉 Institutions may be hedging into earnings
🌪️ Earnings risk looms – volatility expected
📉 Some models say no trade – we say: controlled risk, tight leash
⸻
🧨 Strategy:
🔹 Single-leg naked call only
🔹 Avoid spreads due to IV & potential gap risk
🔹 Scale out if gain >30% early-week
🔹 CUT FAST if volume + price diverge
⸻
🔥 Quick Verdict:
Momentum > fear, but don’t ignore the smoke.
TSLA 332.5C — Risk 1 to Make 2+
Ready? Let’s ride the wave 📊⚡
#TSLA #OptionsTrading #CallOption #TradingSetup #WeeklyTrade #EarningsSeason #MomentumPlay #TradingViewIdeas #SwingTrade #SmartMoneyMoves

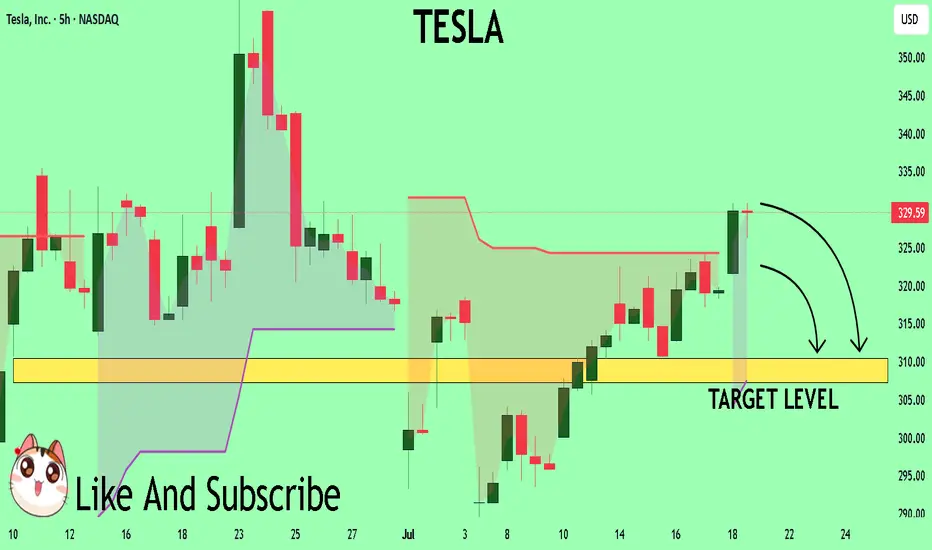
TESLA My Opinion! SELL!
My dear subscribers,
My technical analysis for TESLA is below:
The price is coiling around a solid key level -329.59
Bias - Bearish
Technical Indicators: Pivot Points High anticipates a potential price reversal.
Super trend shows a clear sell, giving a perfect indicators' convergence.
Goal - 310.44
About Used Indicators:
By the very nature of the supertrend indicator, it offers firm support and resistance levels for traders to enter and exit trades. Additionally, it also provides signals for setting stop losses
Disclosure: I am part of Trade Nation's Influencer program and receive a monthly fee for using their TradingView charts in my analysis.
———————————
WISH YOU ALL LUCK
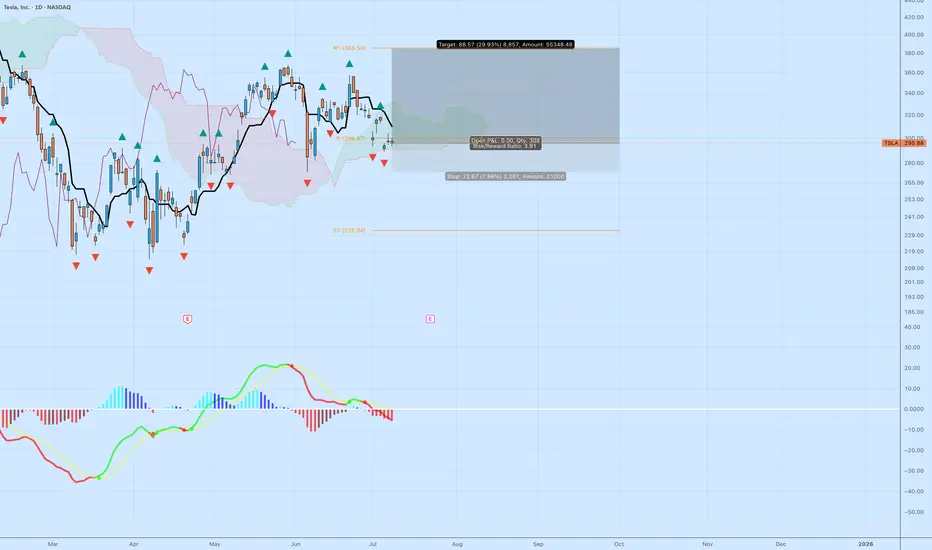
TSLA: High R/R Bounce Play Off the Cloud EdgeTesla NASDAQ:TSLA is sitting at a decision point — testing the edge of the Ichimoku cloud while momentum resets. The setup isn’t confirmed, but the risk/reward is compelling for those watching structure.
🔍 Technical Breakdown
Cloud Support: Price is holding right at the top of the cloud. A breakdown would signal trend weakness, but for now, it's a potential bounce zone.
MACD: Momentum has cooled off, but no bullish crossover yet. Early signs of a flattening histogram could suggest a pivot.
Structure: Horizontal support near $292–295 has held multiple times. If this zone holds again, the upside target opens up quickly.
🎯 Trade Specs
Entry: $296.88
Target: $385.50 (+29.93%)
Stop: $274.21 (–7.66%)
Risk/Reward: 3.91 — solid asymmetry
💡 Trading Insight:
This isn’t about calling bottoms — it’s about defining risk. When price compresses at known support, and you’ve got a 3.9 R/R profile, you don’t need to be right often to be profitable.
Long entry TSLA - Weekly Time FrameIt seems price failed to make a lower low that reversed the most "immediate" uptrend. Therefore, trying to play the entry against those who went short.
Lets see how it plays ouy
UPTADE TESLA -- 250 USD still potentialTesla is consolidating in a tight range, showing bearish pressure near the lower boundary of the formation. Moving averages (MA 5/10/30/60) are flattening, indicating a loss of bullish momentum, while the Wavetrend oscillator has issued a sell signal (bearish crossover below the zero line). A downside breakout from this range projects a potential move toward the $250 level, as illustrated by the measured move. This bearish scenario gains validity if price breaks below the $315 support level.
Potential TP still 250 USD

Tesla earnings setup favours upsideTesla is scheduled to report its second-quarter results on Wednesday 23 July, after the New York close of trading. The company is forecast to report revenue of $22.8bn, representing a 10.5% year-on-year decline, with earnings expected to decrease 19% to $0.34 per share. Gross profit margins are also anticipated to contract by 2.3 percentage points to 16.4%, down from 18.7% last year.
Tesla does not provide traditional guidance but instead offers a business outlook. In its first-quarter release, the company noted difficulties in assessing the impact of shifting global trade policies and stated it would revisit its 2025 guidance during the second-quarter update. Consequently, investors will undoubtedly be focused on any insights regarding 2025 delivery forecasts, especially given the weak performance in the first half of 2025.
Given the current uncertainty, the market is pricing in a 7.5% rise or fall in the shares following the earnings release. Options positioning is relatively neutral, with only a slight bullish bias. However, there is significant support for the stock between $280 and $300, marked by substantial put gamma levels. Conversely, resistance from call gamma exists between $325 and $330. This setup suggests that it could be easier for the stock to rise rather than fall following the results.
The technical chart clearly illustrates this scenario, highlighting strong support around $290 that dates back to March. More recently, the shares have encountered resistance around the $330 mark. If Tesla can successfully break above this resistance, the stock could move towards approximately $360, while downside seems limited to around $290 to $300.
Written by Michael J. Kramer, founder of Mott Capital Management.
Disclaimer: CMC Markets is an execution-only service provider. The material (whether or not it states any opinions) is for general information purposes only and does not take into account your personal circumstances or objectives. Nothing in this material is (or should be considered to be) financial, investment or other advice on which reliance should be placed.
No opinion given in the material constitutes a recommendation by CMC Markets or the author that any particular investment, security, transaction, or investment strategy is suitable for any specific person. The material has not been prepared in accordance with legal requirements designed to promote the independence of investment research. Although we are not specifically prevented from dealing before providing this material, we do not seek to take advantage of the material prior to its dissemination.

TSLA: Up for earnings on Wednesdayinitial move is, I think $350.
But can Elon bring in the buyers for earnings?
There's a healthy mix of bearish and bullish sentiment, but at the end of the day, promises hold weight, and do they hold weight?
All the best.

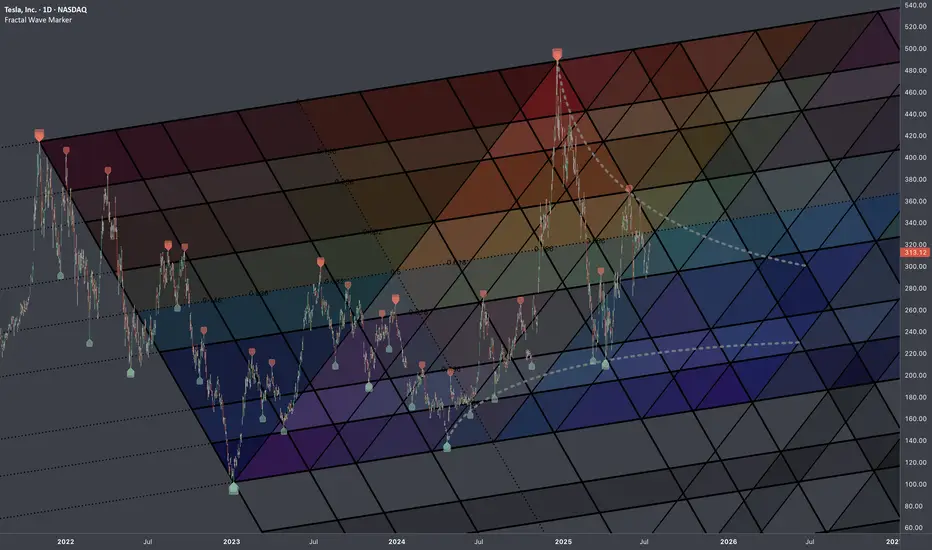
$TSLA: Fib InterconnectionsResearch Notes
Examining interconnection type with regressive angle:
Critical points:
Mapping with 3 fibonacci channels: