TSLA: Anyone knows this pattern?TSLA:
Anyone knows this pattern?
Think contrarily to the market — seek opportunities in things that few people notice or pay attention to, and when you do, opportunities will come to you earlier than they do to the crowd.
.
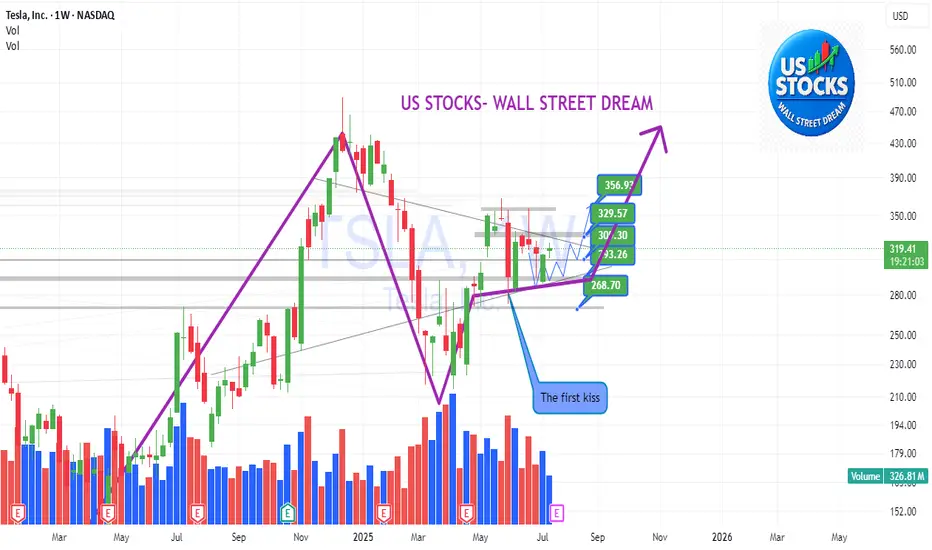
US STOCKS- WALL STREET DREAM- LET'S THE MARKET SPEAK!
TSLA trade ideas
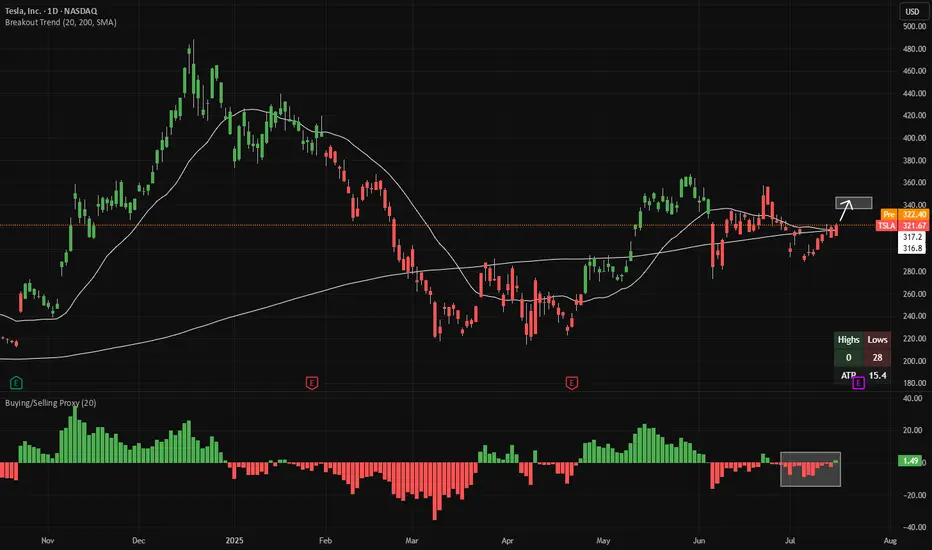
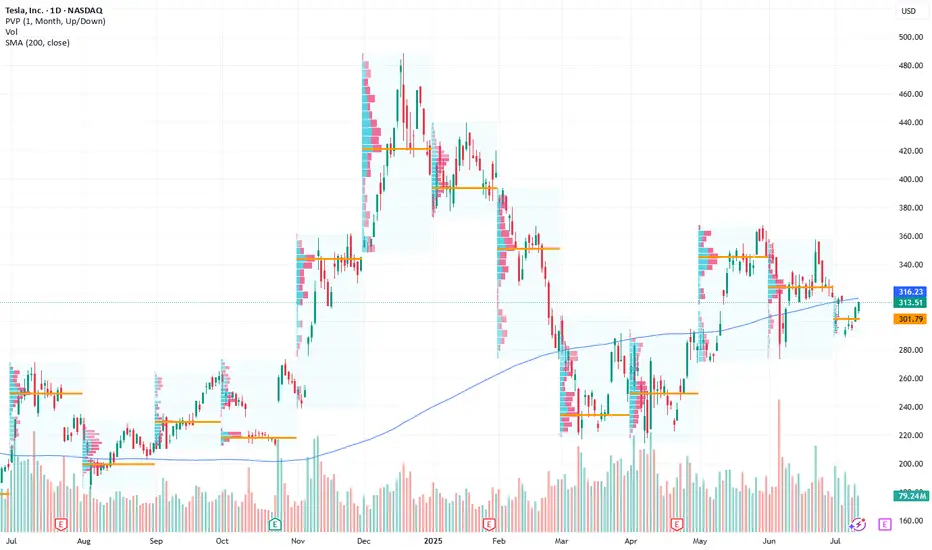
Long TSLA - buyers almost have controlThe buying/selling proxy (bottom panel) is showing signs of net-buying in TSLA. This makes 20-day highs (area indicated in the main chart) more likely to come next. That's around $349.
There is good risk/reward to buy TSLA here, with a stop-loss if the buying/selling proxy flips back to net-selling (red bars). If a 20-day high is made, the candles will change color from red to green.
Both indicators (Breakout Trend and Buying/Selling Proxy) are available for free on TradingView.
Tesla Bulls Assemble: It’s Time for a Clean Robbery🚨🔥TESLA STOCK ROBBERY BLUEPRINT: Thief Trading Heist Plan v2.0🔥🚨
(Swing & Day Traders, Scalpers — Welcome to the Ultimate Market Raid)
🌍 Greetings, Money Makers & Market Bandits!
Hola! Ola! Bonjour! Hallo! Marhaba! Salute from the global Thief Squad! 💰💸🕶️
Today, we’re unleashing a bold market raid on NASDAQ:TSLA (Tesla Inc.), using our signature Thief Trading Strategy™ — a fusion of technical precision, smart risk, and fundamental power. This is not your average trade idea — this is a robbery plan, tailor-made for those ready to outsmart the market with elite tactics.
🎯 The Mission: Steal the Bullish Breakout Before the Bears Wake Up!
Market Status:
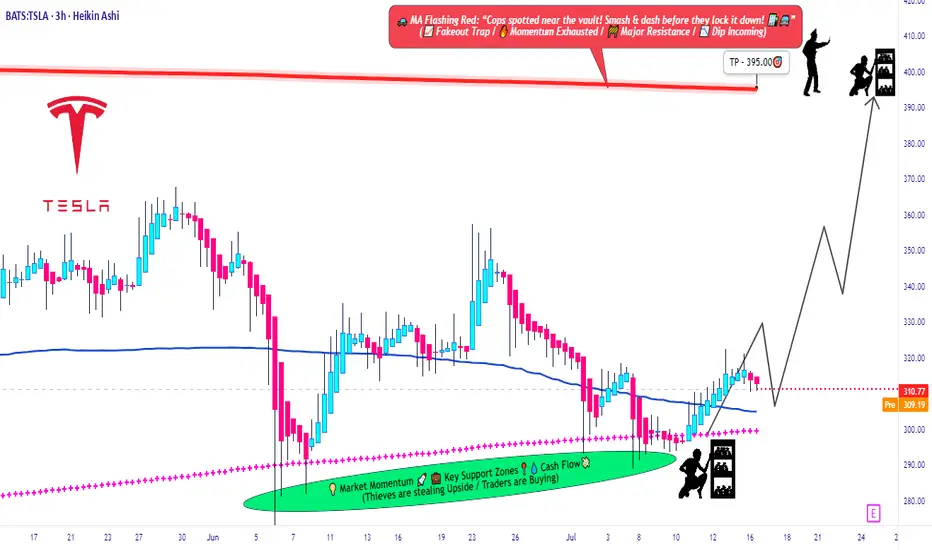
Tesla is showing early signs of bullish strength — short-term consolidation with a potential breakout toward the upper red zone. However, that red zone is where the “Police” (resistance + short sellers) wait to ambush — so we enter with strategy, not emotion.
🟢 Entry Zone – "Vault is Open, Thieves Assemble!"
We’re looking for a long entry anywhere inside the most recent pullback zones (use 15m / 30m candles). Place layered buy-limit orders like a DCA thief stacking charges, targeting the swing low or support wick.
🔑 Pro Tip: Be patient. Let the pullback bless your orders. We rob smarter, not harder.
🛑 Stop Loss – "Escape Route Planned"
Stop Loss = Placed under swing low (3H TF). Current suggested SL: $280.00 (adjust for risk profile).
💬 Thief Note: Your SL depends on position size, number of entries, and account leverage. Never risk your life savings on one job. 😉
🎯 Target Zone – "The Big Loot"
Main Target 🎯: $395.00
Optional Exit: Trail your SL and escape early with bags full of gains. Exit before the trap if heat rises. 🔥
👀 Scalpers – "Fast Hands Get First Cash"
Stick to the long side only. Shorting this train is standing in front of a robbery truck. Use trailing SLs and grab those quick gains.
If you're a small account thief — no worries — ride with the swing crew. We share the loot.
📊 Why the Heist Now?
TSLA's move is supported by:
🔍 Fundamental strength & positive sentiment
🌐 Macro tailwinds & sector rotation favoring EV/Tech
🧠 Intermarket & index alignment
📰 Bullish outlook from recent positioning and COT data
🧨 Consolidation base forming an explosive setup
⚠️ Caution Tape – News Alert Zone
🚨Stay Clear of Major News Releases!
Avoid opening fresh entries during high-impact news. Use trailing SLs to protect your gains. Market heat can go nuclear — be alert, not emotional.
💖 Support the Heist – Smash That BOOST Button!
If you love this Thief Strategy, hit the BOOST 💥
Help us reach more robbers, dreamers, and money makers across TradingView. Let’s build the biggest, smartest, most strategic trading crew ever.
📌 Disclaimer (We're Thieves, Not Financial Advisors)
This is not financial advice — it’s a strategic idea shared for educational purposes. Adjust based on your own risk profile. Never enter a robbery without a plan. 🧠💼
🔥 Stay locked in. Another market heist blueprint is coming soon.
Until then — keep your charts clean, your entries smart, and your exits legendary.
💸Rob the Market — The Thief Way™
🐱👤🎯📈🚀
TSLA about to put in a huge reversal dayCoinrotator.app signaling higher after a 3 month consolidation.
Tesla: Still Pointing LowerTesla shares have recently staged a notable rebound, gaining approximately 10%. However, under our primary scenario, the stock remains in a downward trend within the turquoise wave 5, which is expected to extend further below the support level at $215.01 to complete the magenta wave (3). This move is part of the broader beige wave c. However, if the stock continues to rally in the near term and breaks through resistance at $373.04 and $405.54, we would need to consider that wave alt.(II) in blue has already been completed (probability: 38%).
📈 Over 190 precise analyses, clear entry points, and defined Target Zones - that's what we do (for more: look to the right).

Tesla -> The all time high breakout!🚗Tesla ( NASDAQ:TSLA ) prepares a major breakout:
🔎Analysis summary:
Not long ago Tesla perfectly retested the major support trendline of the ascending triangle pattern. So far we witnessed a nice rejection of about +50%, following the overall uptrend. There is actually a quite high chance that Tesla will eventually create a new all time high breakout.
📝Levels to watch:
$400
🙏🏻#LONGTERMVISION
Philip - Swing Trader

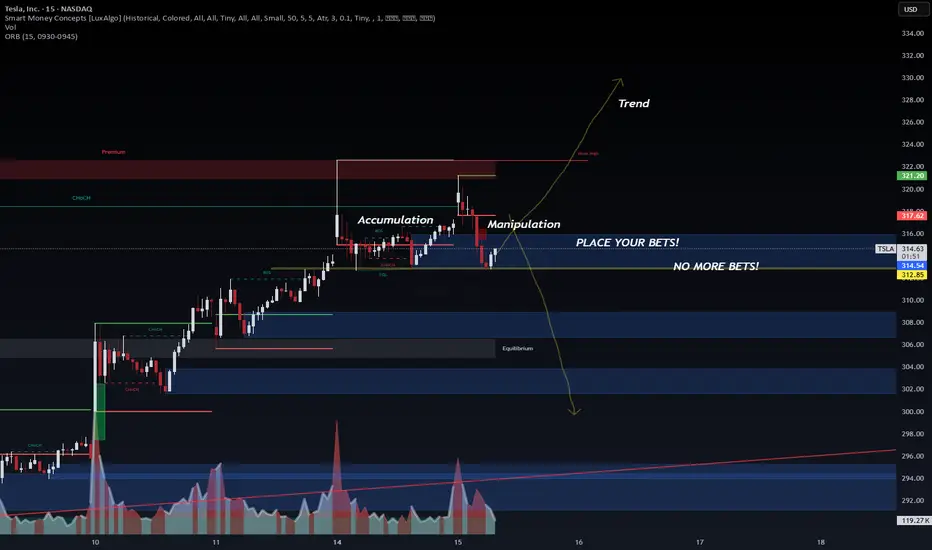
Classic accumulation, manipulation and trend @ TSLA.Looks like someone knows something, or is it just me hallucinating. Can't be both :D
Please see the chart for pattern analysis of what it seems to be a accumulation followed by manipulation, and now the stock is looking for its trend. Whatever happens, I think we are going to see a big move either direction. I am betting on the bullish side with 335 C contracts. Light position, starter.
Front-test, not fin advice.
TSLA WEEKLY OPTIONS SETUP
### 🚗 TSLA WEEKLY OPTIONS SETUP (2025-07-28)
**Big Call Flow. Low VIX. Can Bulls Hold \$325?**
---
📊 **Momentum Overview:**
* **Daily RSI:** 48.2 🔻 → *Neutral-to-Weak*
* **Weekly RSI:** 57.1 🔻 → *Still bullish zone, but falling*
⚠️ **Interpretation:** Momentum is softening, trend in question.
📉 **Volume Context:**
* **Volume Ratio:** 1.3x ⬆️ (vs. last week)
* **Price Change:** -0.77% despite that volume
🔍 *Distribution Alert:* Institutions may be selling into strength.
📈 **Options Flow:**
* **Call/Put Ratio:** **1.70** = 🚨 *Bullish flow confirmed*
* **Volatility (VIX):** 15.16 🟢 Favorable for directional plays
✅ Strong setup for options traders riding short-term momentum
---
### 🧠 **Weekly Sentiment Scorecard:**
* ✅ **Bullish Signals (2):** Options Flow, Volatility
* ⚠️ **Neutral Signals (2):** Daily & Weekly RSI
* ❌ **Bearish Signal (1):** Volume pattern = distribution risk
**Overall Bias:** 🟢 *Moderate Bullish*
---
### 🔥 **TRADE SETUP IDEA:**
🎯 **Strategy:** Long Call Option
* 📌 **Instrument:** TSLA
* 💵 **Strike:** \$355C
* 📅 **Expiry:** Aug 1, 2025
* 💸 **Entry:** \~\$0.75
* 🎯 **Profit Target:** \$1.50
* 🛑 **Stop Loss:** \$0.45
* 🔒 **Key Support to Watch:** \$327.50 — lose that = exit fast
📈 **Confidence Level:** 65%
⚠️ **Gamma Risk:** High → trade small, manage tight.
---
### 📦 TRADE\_DETAILS (JSON Format for Algo/Backtest):
```json
{
"instrument": "TSLA",
"direction": "call",
"strike": 355.0,
"expiry": "2025-08-01",
"confidence": 0.65,
"profit_target": 1.50,
"stop_loss": 0.45,
"size": 1,
"entry_price": 0.75,
"entry_timing": "open",
"signal_publish_time": "2025-08-01 09:30:00 UTC-04:00"
}
```
---
### 🧭 **Quick Notes for Traders:**
* ✅ Bulls have short-term edge — but **momentum is fading**
* ⚠️ If TSLA breaks below **\$325**, exit fast.
* 🔍 Watch for fakeouts: options flow is bullish, but volume says “not so fast.”
---
📊 TSLA \$355C → Risk \$0.75 to potentially double 📈
💬 Will this hold, or is it a bull trap before a dump? 👀
Comment below ⬇️ and follow for Monday updates!
---
**#TSLA #OptionsFlow #WeeklyTrade #TradingSetup #GammaRisk #AITrading #TeslaStock #UnusualOptionsActivity #SmartMoneyMoves**

A Strategic Long Opportunity Amid VolatilityCurrent Price: $316.06
Direction: LONG
Targets:
- T1 = $324.00
- T2 = $328.50
Stop Levels:
- S1 = $312.50
- S2 = $308.00
**Wisdom of Professional Traders:**
This analysis synthesizes insights from thousands of professional traders and market experts, leveraging collective intelligence to identify high-probability trade setups. The wisdom of crowds principle suggests that aggregated market perspectives from experienced professionals often outperform individual forecasts, reducing cognitive biases and highlighting consensus opportunities in Tesla.
**Key Insights:**
Tesla’s stock presents both short-term risks and long-term upside opportunities. Despite recent earnings misses and margin compression, its pivot into AI and robotics offers significant growth opportunities. Upside resistance zones near $325-$330 create favorable price targets, while support levels at $307-$310 suggest strong buying interest. This environment could favor a long trading strategy, provided disciplined risk management is maintained.
**Recent Performance:**
Tesla recently experienced notable sell-offs following disappointing earnings, attributed to compressed margins and weaker EV demand. However, the stock rebounded 3.5% from last week’s lows, signaling resilience amid uncertainty. Year-to-date, Tesla remains one of the top-performing stocks with a 54% price increase, reflecting strong underlying investor confidence in its long-term story.
**Expert Analysis:**
Market experts are divided on Tesla’s trajectory. Near-term fundamentals appear challenging with declining revenue (-12% YoY) and price cuts impacting profitability. However, bullish projections from analysts such as Kathy Wood highlight Tesla’s potential for disruptive innovation in AI and robotics. Its ambitious initiatives like robo-taxi deployment add speculative appeal but also introduce scaling and regulatory risks.
**News Impact:**
Tesla’s upcoming robo-taxi launch in San Francisco is poised to impact market sentiment significantly. While safety drivers will be required during the initial rollout, scalability and regulatory challenges could limit the project’s immediate impact. Meanwhile, recent disappointing earnings results may weigh on sentiment in the short term while providing an opportunity for potential retrishments off support levels.
**Trading Recommendation:**
Given the current setup, Tesla appears poised for long-term growth, with upside resistance levels suggesting a viable rally opportunity. Investors should consider taking a bullish position while maintaining stops near key support zones to mitigate downside risks. This balanced approach aligns well with Tesla’s speculative appeal and broader investor sentiment.

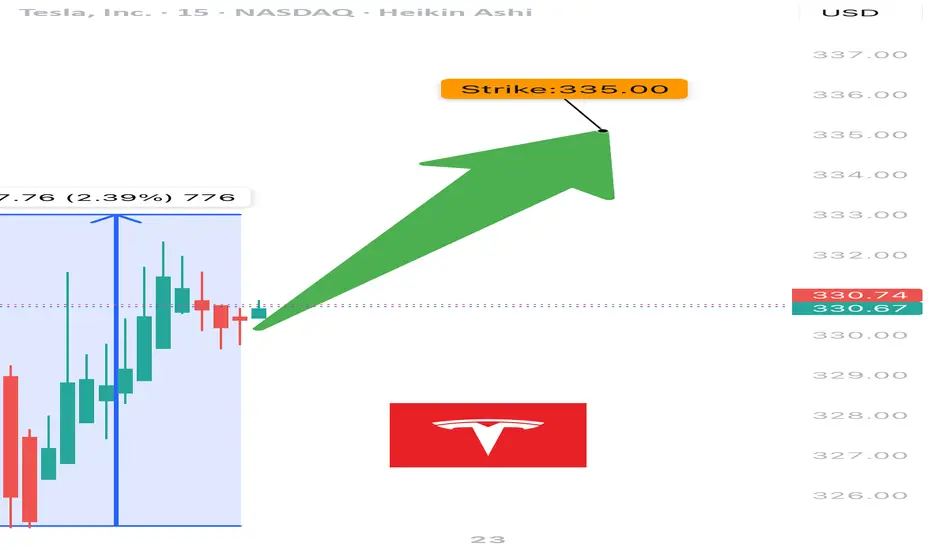
$TSLA Weekly Call Play – 07/22/25
🚀 NASDAQ:TSLA Weekly Call Play – 07/22/25
RSI Bullish 📈 | Options Flow Strong 🔁 | Volume Weak 💤 | 3DTE Tactical Entry
⸻
📊 Market Snapshot
• Price: ~$332–335 (spot near strike)
• Call/Put Ratio: 🔁 1.24 – Bullish Flow
• Daily RSI: ✅ 57.6 – Rising momentum
• Weekly RSI: ⚠️ 54.8 – Neutral / flattening
• Volume: ❌ Weak – Institutional absence
• Gamma Risk: ⚠️ Moderate (DTE = 3)
• VIX: ✅ Favorable
⸻
🧠 Trade Setup
{
"Instrument": "TSLA",
"Direction": "CALL",
"Strike": 335.00,
"Entry": 9.90,
"Profit Target": 15.00,
"Stop Loss": 6.00,
"Expiry": "2025-07-25",
"Confidence": 0.65,
"Size": 1,
"Entry Timing": "Open"
}
⸻
🔬 Sentiment Breakdown
Indicator Signal
📈 Daily RSI ✅ Bullish – confirms entry
📉 Weekly RSI ⚠️ Flat – no long-term edge
🔊 Volume ❌ Weak – no institutional bid
🔁 Options Flow ✅ Bullish (C/P = 1.24)
💨 VIX ✅ Favorable for upside trades
⏳ Gamma Decay ⚠️ High risk (3DTE)
⸻
📍 Chart Focus
• Support Zone: $328–$330
• Breakout Watch: $335+
• Target Zone: $340–$345
• ⚠️ Risk Watch: Volume divergence + gamma decay on low move
⸻
📢 Viral Caption / Hook (for TradingView, X, Discord):
“ NASDAQ:TSLA bulls flash 335C with confidence, but volume’s asleep. RSI’s in, gamma’s ticking. 3DTE lotto with caution tape.” 💥📉
💵 Entry: $9.90 | 🎯 Target: $15.00+ | 📉 Stop: $6.00 | ⚖️ Confidence: 65%
⸻
⚠️ Who This Trade Is For:
• 🔁 Options traders chasing short-term call flows
• 📈 Momentum scalpers riding RSI pop
• 🧠 Disciplined risk managers eyeing 3DTE setups
⸻
💬 Want a safer bull call spread (e.g., 330/340) or risk-defined iron fly for theta control?
Just ask — I’ll build and optimize it for you.
TESLA 400 BY END OF YEAR !! 5 REASONS !!!
1. **Strong Earnings and Revenue Growth**
Tesla has a track record of exceeding earnings expectations. If the company reports robust financial results in Q3 and Q4—driven by higher vehicle deliveries and growth in its energy storage business—investors are likely to gain confidence. This could push the stock price upward as Tesla demonstrates its ability to scale profitably.
2. **Advancements in Autonomous Driving**
Tesla’s Full Self-Driving (FSD) technology is a game-changer in the making. If Tesla achieves significant progress toward Level 4 or 5 autonomy—where vehicles can operate with little to no human intervention—it could position the company as a leader in transportation innovation. Such a breakthrough would likely excite investors and drive the stock price higher.
3. **Battery Technology Innovation**
Tesla is working on developing cheaper, longer-lasting batteries, which could lower production costs and improve profit margins. If the company announces advancements in battery tech—such as improvements from its Battery Day initiatives or new manufacturing processes—it could signal a competitive edge, boosting the stock to $400.
4. **Global Expansion and Production Increases**
Tesla’s new Gigafactories in Texas and Berlin are ramping up production, while potential market entries like India loom on the horizon. Increased output and access to new customers signal strong growth potential. If Tesla successfully scales its operations, investors may see this as a reason to push the stock price toward $400.
5. **Favorable Market Trends and Government Policies**
The global shift toward sustainable energy and electric vehicles (EVs) is accelerating, supported by government incentives and regulations favoring clean energy. If EV adoption continues to rise and policies provide a tailwind—such as subsidies or stricter emissions standards—Tesla, as an EV leader, could see increased demand and a higher stock valuation.
While reaching $400 by year-end is ambitious, Tesla’s strong brand, innovative edge, and leadership under Elon Musk could make it achievable. That said, risks like market volatility and growing competition from other EV makers could pose challenges. If these five factors align, however, Tesla’s stock has a solid shot at hitting that target.

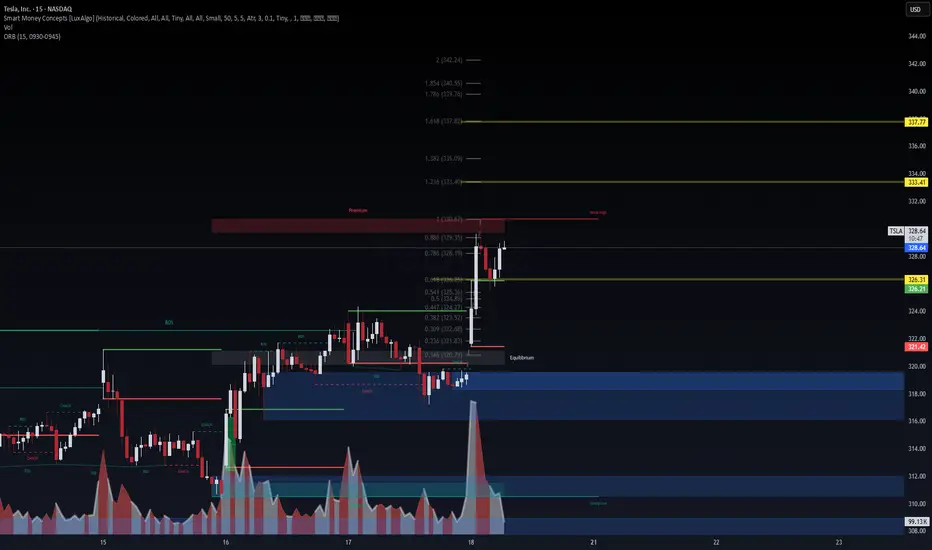
$TSLA Fibonacci Expansion Targets in Play – VolanX Precision Le🔋 NASDAQ:TSLA Fibonacci Expansion Targets in Play – VolanX Precision Levels
TSLA just powered through a clean bullish reversal from the discount zone and now trades inside the premium supply block near 330.67. This zone aligns with:
📍 0.886 Fib (329.35)
📍 Weak high at prior inefficiency
📍 VolanX ORB resistance (326.21–330.67)
🧠 WaverVanir VolanX Setup:
✅ CHoCH → BOS → Premium Tap
✅ ORB (15) broken to upside with volume (76.6K)
🟡 Currently testing equilibrium/premium confluence
🎯 Fibonacci Expansion Targets:
1.236 → 333.40
1.382 → 335.09
1.618 → 337.77
2.0+ range → 342–347 (if melt-up continues)
⚠️ Trade Logic:
A pullback to 326.30 may serve as a re-entry zone.
Watch for rejection at 330.67 — if it fails, bulls could reclaim control into the 333–337 fib cluster.
Macro + flows suggest continuation, but premium rejection remains possible. Stay nimble.
📌 #TSLA #Tesla #WaverVanir #VolanXProtocol #SmartMoneyConcepts #ORB #Fibonacci #LiquidityZones #BreakoutSetup #TradingView #OptionsFlow #Scalping #MacroMomentum
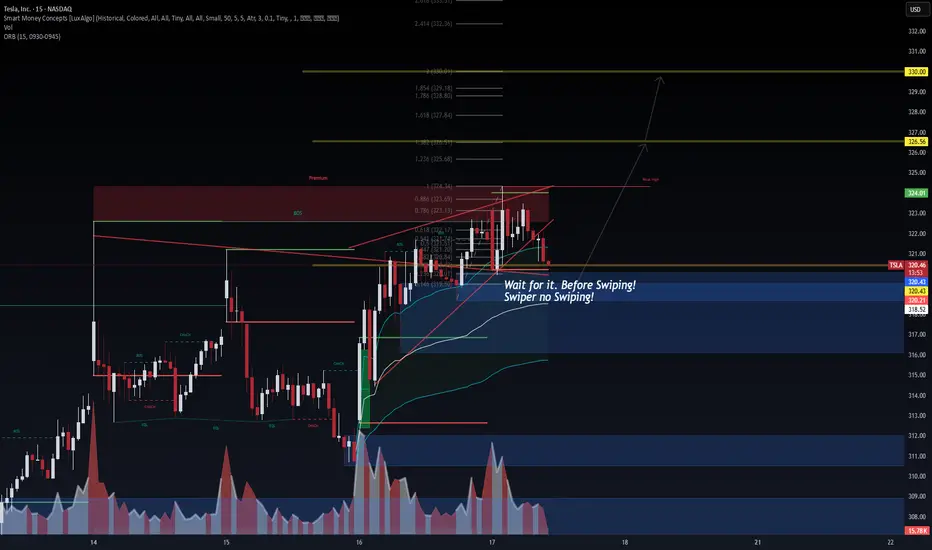
TSLA: Time for the 2/3 rally?TSLA remains tightly wedged inside a bullish pennant, hovering just above the ORB high (324.01) and within the premium SMC zone. Smart Money structure is clear:
🔹 Bullish BOS + CHoCH stacking
🔹 Fibonacci confluence from 0.618 to 0.886 holding strong
🔹 Hidden demand resting at 320.21 / 318.66 zone
🧠 VolanX DSS Logic:
Break above 324.34 unlocks liquidity toward 1.236 = 325.68, then key magnet zone 326.56
Liquidity sweep + micro pullback ideal entry signal
Volume shows absorption at each higher low → bullish intent
🎯 Trade Plan (15m):
Entry: 322.00–324.00 with confirmation
Target: 326.56 → 328.18
Invalidation: Below 320.21 BOS flip
ORB + Fib + SMC stack = High-conviction directional play
💬 Price may seek inefficiencies left in prior imbalance zones below, but current order flow favors upside continuation.
📢 This analysis is powered by the VolanX Protocol under WaverVanir DSS — where liquidity meets logic.
#TSLA #WaverVanir #VolanX #SMC #DayTrading #Fibonacci #ORB #SmartMoneyConcepts #Tesla #MacroEdge #OptionsFlow
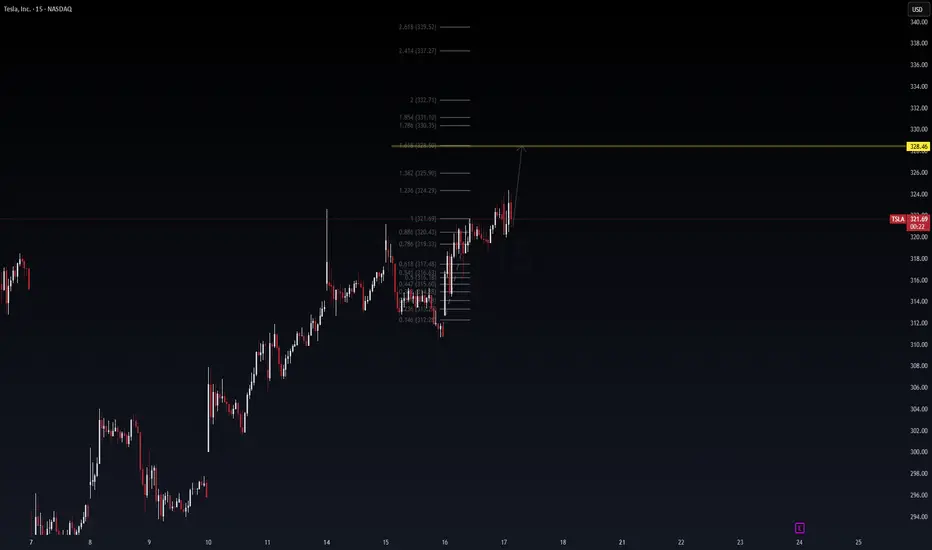
TSLA Fibonacci Launchpad: 328.46 in Sight? (15-min Daytrade Setu🔋 TSLA Fibonacci Launchpad: 328.46 in Sight? (15-min Daytrade Setup)
Posted by WaverVanir_International_LLC | Powered by VolanX Protocol
TSLA continues to show bullish continuation structure on the 15-min timeframe. After a textbook retracement to the golden pocket (0.618–0.786), bulls defended $315-$317 zone and reclaimed $321 resistance.
📌 Technical Thesis
Clean impulsive wave from $312.24 → $321.69
Consolidation → Breakout structure with low selling volume
Fib extension targets 1.618 at $328.46, followed by confluence zones at $331 and $332.71
Price respecting higher lows, forming micro bull flag
📈 Entry Idea:
Intraday breakout confirmation above $324.29 (1.236 extension)
Risk-managed long setup with stops below $320.43 (0.886)
Target zones: $328.46 → $330.35 → $332.71
⚠️ Risk Note:
Heavy resistance expected around $328–$332 zone. Scalp profits near extensions or trail stops tight.
🔮 VolanX Signal Score: 7.5/10
Favoring upside continuation unless macro catalyst shocks sentiment.
#TSLA #DayTrading #Fibonacci #Scalping #VolanX #WaverVanir #TechStocks #OptionsFlow #AITrading #PriceTargets #TeslaTraders
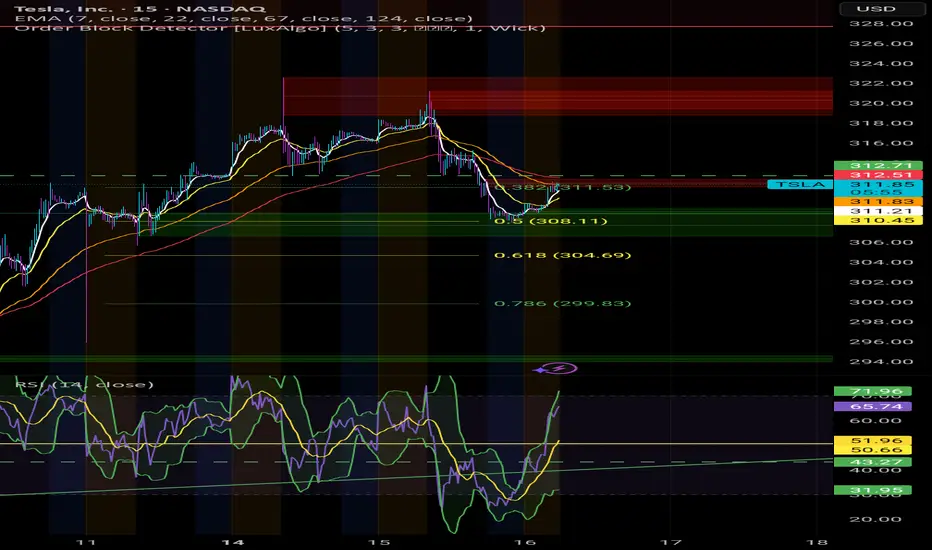
TSLA: DT 7/16/2025Took a trade at the fair value gap 15 min TF, If the market is going to reverse it is either going to be from .50 or .382.

Is the BullRun over? I don't think so. $TSLAYesterday we saw a somewhat heavy fall in Indexes, and it probably scared alot of retail Bulls outs.
However, it seems we've fallen straight into potential medium term supports across multiple stocks in the markets.
I'm convinced we will get a good economic data print today.
This would open the door to new ATHs, again, in the Indexes.
For this to play out, the local bottoms established over night need to hold.
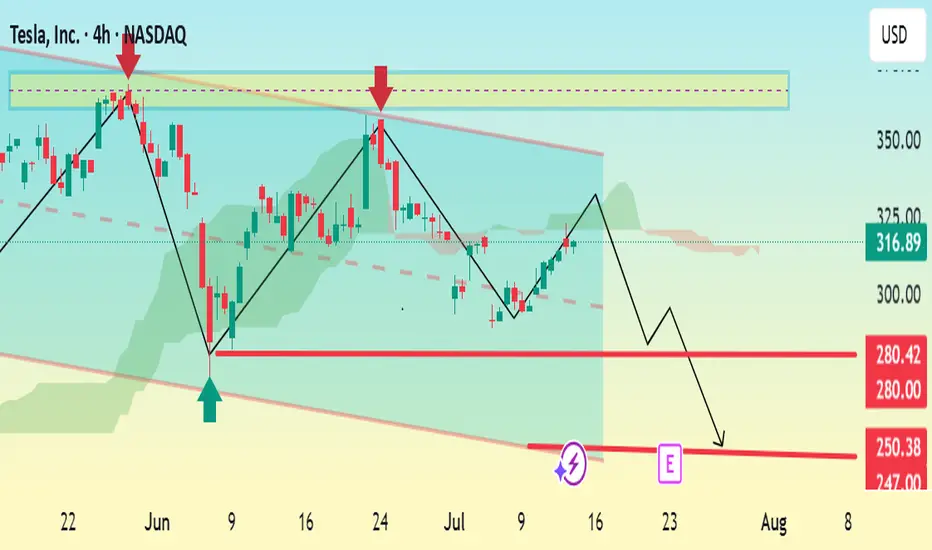
TSLA 4H Analysis – Bearish Reversal Setup📈 Trade Plan Summary
• Entry Range: 316 to 332
• Target 1: 280
• Target 2: 250
• Stop Loss: 370
⸻
📉 Type of Trade:
This appears to be a short (sell) position, since your targets are below the entry point.
⸻
✅ Risk Management Check
Let’s consider your worst-case entry (i.e., highest point in the range: 332) and best-case exit (Target 2 = 250):
• Risk = 370 - 332 = 38 points
• Reward = 332 - 250 = 82 points
📊 Risk:Reward Ratio ≈ 1:2.15 — Good setup!
TSLA - Explosive Bounce TSLA Before the Drop? | EW Analysis My primary view is that we’re in the final stages of an ending diagonal, which could lift the price to new all-time highs, potentially between $460 and $650. Wave 4 of this structure appears to have completed after precisely tagging key Fibonacci support, and since then, we've already seen a strong bounce from that low. I’m now watching for the development of the final wave in this pattern, which could deliver gains of over 100% from current levels.
However, I’m not fully convinced by the internal shape of the diagonal so far. That’s why I’m also have an alternative scenario: in this case, the recent low may have marked the end of Wave 2 within a much larger diagonal. If true, this opens the door to a much more extended rally potentially reaching $1,000 before we see a major correction.
That said, this second scenario is not my preferred one, and a decisive break below the recent lows would invalidate both counts.

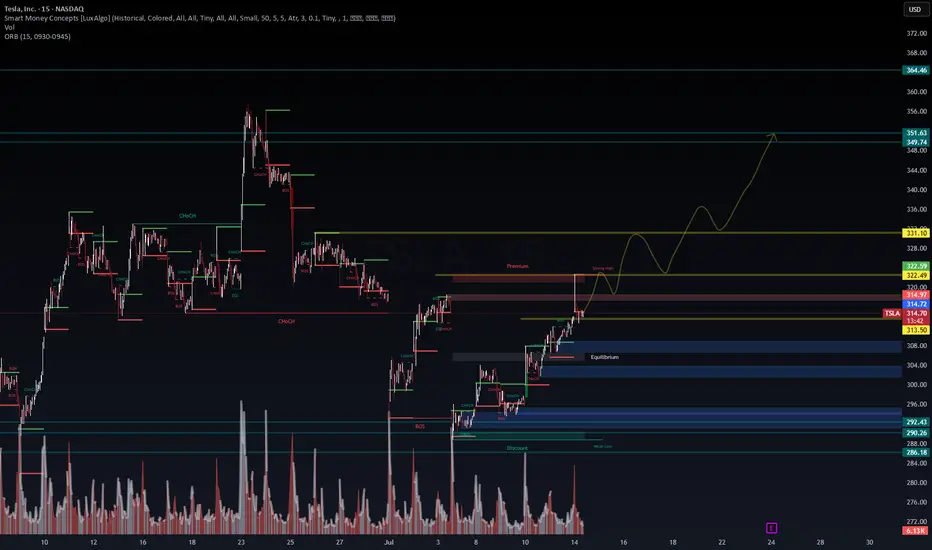
TSLA | Breakout Fuel Loaded – Will the Trend Accelerate Toward 🚗 TSLA | Breakout Fuel Loaded – Will the Trend Accelerate Toward $350?
🔍 Chart Type: 15m
🧠 System: Smart Money Concepts (LuxAlgo) + WaverVanir DSS
📊 Volume: 2.08M
🧭 Narrative: Liquidity Engine + Bullish Flow Momentum
📈 Current Price: $314.78
Clean breakout above BoS and ChgofCHoCH
Currently testing Strong High within a defined Premium Zone
EMA Stack (20/50/100/200) is bullishly aligned
📌 Key Levels to Watch:
📍 Premium Resistance: ~$315–$318
⚖️ Equilibrium Support: ~$309
💧 Discount Liquidity Zones: $292.43, $290.26
🚀 Upside Targets:
Minor: $322.49
Mid: $331.10
Major: $349.74 → $351.63 (projected wave peak)
📈 Bullish Case (Preferred by DSS Flow Model):
Retest of strong high → rally toward $322 then $331
Momentum and volume support trend acceleration
Break of $331 opens path toward $349.74–$351.63 (final wave)
📉 Bearish Invalidator:
Break below equilibrium ($309) → Discount zone retest
Watch $292–$286 for final liquidity sweep if rejection occurs
📅 Catalyst:
Earnings (📦 E icon marked) + macro tech sentiment could ignite explosive continuation
Market structure favors liquidity vacuum toward premium targets
🧠 VolanX DSS Sentiment: STRONG BULLISH
✅ Structure: Uptrend
✅ Volume: Expanding
✅ Momentum: Aligned
🟡 Risk: Premium rejection short-term possible
🔁 Executed via VolanX AI Scanner + WaverVanir DSS Engine
📊 “The Edge Is a System. The System Is Intelligence.”™
#WaverVanir #TSLA #SmartMoneyConcepts #PriceAction #LiquidityZones #Tesla #TechnicalAnalysis #VolanX #InstitutionalEdge #AITrading #QuantFinance
Stocks SPOT ACCOUNT: TESLA stocks buy trade with take profitStocks SPOT ACCOUNT: MARKETSCOM:TESLA stocks my buy trade with take profit.
Buy Stocks at 297 and Take Profit at 319.
This is my SPOT Accounts for Stocks Portfolio.
Trade shows my Buying and Take Profit Level.
Spot account doesn't need SL because its stocks buying account.

Tesla’s Next Move: Bullish Play Amid AI and Volatility Current Price: $313.51
Direction: LONG
Targets:
- T1 = $319.00
- T2 = $329.15
Stop Levels:
- S1 = $307.75
- S2 = $303.60
**Wisdom of Professional Traders:**
This analysis synthesizes insights from thousands of professional traders and market experts, leveraging collective intelligence to identify high-probability trade setups. The wisdom of crowds principle suggests that aggregated market perspectives from experienced professionals often outperform individual forecasts, reducing cognitive biases and highlighting consensus opportunities in Tesla.
**Key Insights:**
Tesla’s recent AI innovation and its expanding robo-taxi footprint signal long-term growth potential while short-term volatility requires strategic entry points. Market sentiment has significantly improved with positive news about the integration of Gro 4 AI, enhancing Tesla’s autonomous vehicle advancements. Trading at critical levels, Tesla offers a potential buying opportunity near key support zones.
The rallying investor focus on Tesla’s technological edge places it among the leaders in automation-driven growth. Despite macroeconomic pressures, Tesla’s proactive efforts in leveraging cost efficiencies and scaling autonomous solutions are helping to sustain bullish momentum.
**Recent Performance:**
Tesla demonstrated notable resilience during a turbulent earnings season, holding strong amidst mixed market signals. Recent delivery figures reflected a 13% year-over-year decline, which stirred concerns. Yet, the stock was buoyed by positive AI-related news and the market-wide optimism surrounding automation technologies, enabling Tesla to maintain its pivotal price range.
**Expert Analysis:**
Analysts acknowledge Tesla’s robust innovation pipeline centered around driver assistance and robo-taxi functionality powered by the Gro 4 AI platform. Concerns related to Elon Musk’s focus and governance have tempered enthusiasm for some traders, but these have largely been offset by Tesla’s strategic actions to sustain revenue and growth. Tesla’s prominent role in setting the market narrative for autonomous vehicles and broader EV adoption ensures ongoing support from long-term investors.
Tesla’s recent moves are growing investor confidence as it seeks to hedge against broader economic uncertainties and mitigate risks around regulatory changes. Its expansion strategy continues to highlight its leadership within the EV space, while early adopters of its AI-driven solutions may set the pace for sustainable revenue expansion.
**News Impact:**
The integration of Gro 4 AI is expected to significantly enhance Tesla’s robo-taxi and autonomous vehicle functionality, enabling it to capture market share in urban mobility services. Tesla’s announcement of an expanded robo-taxi fleet targeting key metropolitan areas could help offset delivery declines and drive future recurring revenues. While concerns about Elon Musk’s governance persist, ongoing innovation continues to support Tesla’s bullish outlook in global EV markets.
**Trading Recommendation:**
Tesla’s current price action signals an advantageous entry point for a long position, reinforced by recent bullish news and industry-leading innovations. Short-term traders can target $319.00 and $329.15 while maintaining disciplined stop-loss levels at $307.75 and $303.60. With strong support from institutional sentiment and expanding AI applications in its product line, Tesla offers substantial upside for bullish investors.
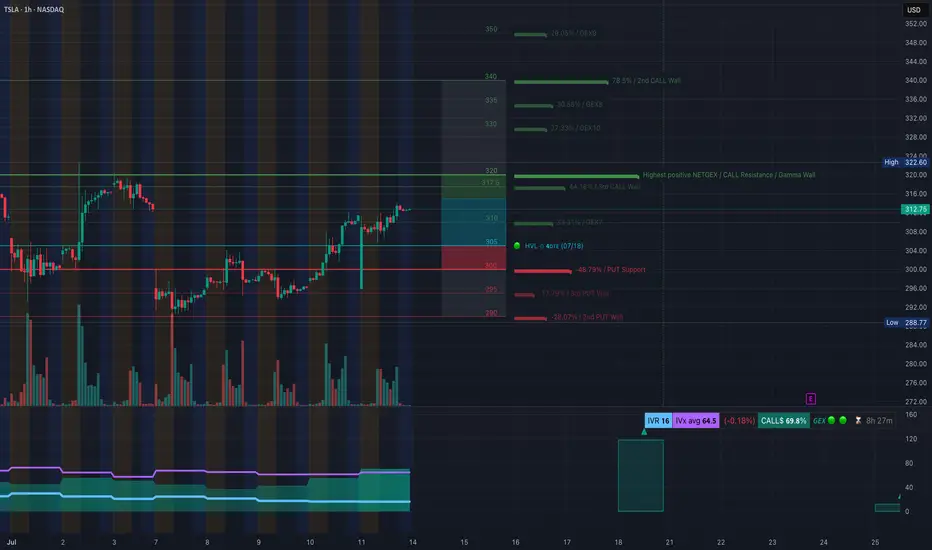
TSLA TA – Call Side Dominance Nearing Resistance-July 14TSLA GEX Analysis – “Call Side Dominance Nearing Critical Resistance 💥”
GEX Snapshot:
* Highest Positive GEX / Resistance: $320 – This is where call positioning is heaviest and likely where dealer hedging could resist further upside.
* Call Walls:
* $317.5 (44.18%)
* $320 (High NetGEX)
* $335–$340 (Intermediate resistance, weaker positioning beyond)
* Put Walls:
* $300 (48.79% support)
* $295 / $290 (3rd/2nd tier walls)
Options Oscillator:
* IV Rank (IVR): 16 (Low)
* IVx avg: 64.5
* Call Positioning: 69.8% (very bullish skew)
* GEX: 🔰 Bullish
🎯 Options Trade Setup:
Direction: Cautiously Bullish – but close to key resistance!
⚡ Aggressive Bullish Setup:
* Entry: Near $312.75 (current price)
* Strike: Buy $317.5C or $320C expiring this week
* Target: $320+
* Stop: Close below $308
* Note: Watch dealer hedging around $320. If TSLA breaks $320 with strength, gamma squeeze toward $335 is possible.
🛡️ Bearish Reversal Setup (if rejected at $320):
* Strike: Buy $310P or $305P (next week expiry)
* Trigger: Rejection at $320 + breakdown below $311
* Target: $304–$300
* Stop: Above $321
📉 TSLA 1-Hour Chart Analysis – “Breakout Zone or Fakeout Trap? Watch These Levels 🎯”
Structure:
* TSLA broke above the CHoCH and BOS zones between $308–$310. Price is consolidating under the $317.5–$320 resistance (also seen on GEX).
* There’s a clean ascending wedge/channel forming – upper boundary is near $320, and the lower trendline is near $304.
Key Zones:
* Supply Zone (Purple): $317.5–$320 (watch for rejection or breakout)
* Support: $309.8 (BOS zone), then $304 (trendline + demand overlap)
* Demand Zone: $293.5–$296 (origin of last rally)
🛠️ Trade Scenarios:
🔼 Bullish Continuation:
* Entry: Break and hold above $320
* TP1: $325
* TP2: $335
* SL: Below $311
🔽 Bearish Pullback:
* Entry: Rejection at $317.5–$320 zone and break below $309
* TP1: $304
* TP2: $296
* SL: Above $320
✅ Summary:
* GEX favors calls but $320 is a critical gamma wall – if broken, it opens room toward $335+.
* On the chart, watch the rising channel and upper resistance at $320.
* Bullish momentum is still intact unless $309 fails.
* Stay nimble: scalp calls on breakout, or prepare for a reversal put if there's rejection and structure break.
Disclaimer: This analysis is for educational purposes only and not financial advice. Trade at your own risk with proper risk management.
TSLA / Earning seasonNASDAQ:TSLA showing nice price action bounce off the base last week. With earnings season here, watch the $315 level — a breakout could send it toward $320 and $326 next 🚀📈 #TSLA
