UCO in Buy ZoneMy trading plan is very simple.
I buy or sell when at three of these events happen:
* Price tags the top or bottom of parallel channel zones
* Money flow spikes beyond it's Bollinger Bands
* Stochastic Momentum Index (SMI) at near oversold overbought level
* Price at Fibonacci levels
So...
Here's why I'm picking this symbol to do the thing.
Price in buying zone at bottom of channels
Stochastic Momentum Index (SMI) at oversold level
Money flow momentum is spiked negative and under bottom of Bollinger Band
Target is upper channel around $28.50
UCO trade ideas

UCO Stock Chart Fibonacci Analysis 021125Trading Idea
1) Find a FIBO slingshot
2) Check FIBO 61.80% level
3) Entry Point > 28/61.80%
Chart time frame: B
A) 15 min(1W-3M)
B) 1 hr(3M-6M)
C) 4 hr(6M-1year)
D) 1 day(1-3years)
Stock progress: A
A) Keep rising over 61.80% resistance
B) 61.80% resistance
C) 61.80% support
D) Hit the bottom
E) Hit the top
Stocks rise as they rise from support and fall from resistance. Our goal is to find a low support point and enter. It can be referred to as buying at the pullback point. The pullback point can be found with a Fibonacci extension of 61.80%. This is a step to find entry level. 1) Find a triangle (Fibonacci Speed Fan Line) that connects the high (resistance) and low (support) points of the stock in progress, where it is continuously expressed as a Slingshot, 2) and create a Fibonacci extension level for the first rising wave from the start point of slingshot pattern.
When the current price goes over 61.80% level , that can be a good entry point, especially if the SMA 100 and 200 curves are gathered together at 61.80%, it is a very good entry point.
As a great help, tradingview provides these Fibonacci speed fan lines and extension levels with ease. So if you use the Fibonacci fan line, the extension level, and the SMA 100/200 curve well, you can find an entry point for the stock market. At least you have to enter at this low point to avoid trading failure, and if you are skilled at entering this low point, with fibonacci6180 technique, your reading skill to chart will be greatly improved.
If you want to do day trading, please set the time frame to 5 minutes or 15 minutes, and you will see many of the low point of rising stocks.
If want to prefer long term range trading, you can set the time frame to 1 hr or 1 day.
app.outlier.ai

Slowly starting to scale in on OILThe fundamental outlook for oil is looking bullish. Despite seasonality favoring lower crude oil prices towards the end of the year, the conflicts in the Middle East are pushing prices higher.
Technically, the downward move that has been in place since the beginning of July could now experience a correction. Therefore, I’ll begin slowly scaling into oil at the 61.8% retracement level, keeping in mind that prices could drop further before the end of the year.
According to seasonality, we could see the high in oil prices around May 2025.
Let’s see how it plays out.

UCO to $30MODs have suggested that I provide more detail about the picks I make.
Sorry. I'm not as verbose as y'all, and I don't like things to be complicated.
My trading system is very simple.
I buy or sell at top & bottom of parallel channels.
I confirm when price hits Fibonacci levels.
Bonus if a TTM Squeeze in in play.
I hold until target is reached or end of year, when I can book a loss.
So...
Here's why I'm picking this symbol to do the thing.
Price at bottom channel on daily & weekly charts
Stochastic Momentum Index (SMI) at oversold level
In at $26


Crude Oil trade setup for 2024 🛢️I expect the oil price can find a reversal from here. The demand for oil will improve as the global economy starts to improve on the backdrop of lower interest rate levels. This is my outlook for the next 12-month hold period.

UCO a crude oil ETF LONGUCO popped in April and then dropped into a consolidation in May and June where
it set up a base shown by the POC line on the volume profile. Once over the POC
on July 6th on the daily chart coinciding with a golden cross on the HMA 56/210
combination the bull trend began. The dual time frame RS lines in the 60s suggest
more to come. I am trading UCO and similar oil-based instruments including USOUSD
or forex in the near term until I see signals of a topping that are not yet evident.

updated UCO / Oil - going to break, soonthis an update to my prior post, and shows we are compressing quite hard. Look for a break, soon.

A triangle in a triangle. Ride the wavei think oil is going to break up and out. UCO is a great way to play it. Hopefully this is helpful.

Crude Awakening: Why Oil is Set to Explode Crude Oil has been in Wave 2 since June of last year, which is a corrective wave that typically follows a five-wave impulsive move. During this time, prices have been consolidating in a range, forming a base for the next impulsive move to the upside. Recently, Crude Oil bottomed out during the middle of March, confirming the end of Wave 2 and the start of Wave 3. Wave 3 is usually the most powerful wave in a trend, and it is where prices tend to move impulsively in the direction of the trend.
Based on my analysis, I believe that Crude Oil is headed for a strong upward move, with a price target range between HKEX:87 and $105. This is based on a combination of technical analysis and fundamental factors such as supply and demand. The chart suggests that Crude Oil has completed its correction and is now ready to resume its uptrend. In addition, there are several fundamental factors that support higher prices, such as the global economic recovery, the ongoing supply cuts by major oil producers, and the potential for increased demand as economies reopen. All these factors combined suggest that we are in a favorable environment for Crude Oil to head to the upside, and I am confident that this is a good opportunity to invest.

UCO Weekly Fib & VWAPLooking for reversal upon the 0.618 or 0.786 zone, this chart is right in line with USOIL, unlike GUSH, which is lagging well behind USOIL. Building a solid bottom along the 0.618 level. If USOIL moves lower to the $72.00 range, we could see a prime entry at the 0.786 level on UCO of around $20.90.
DYOR

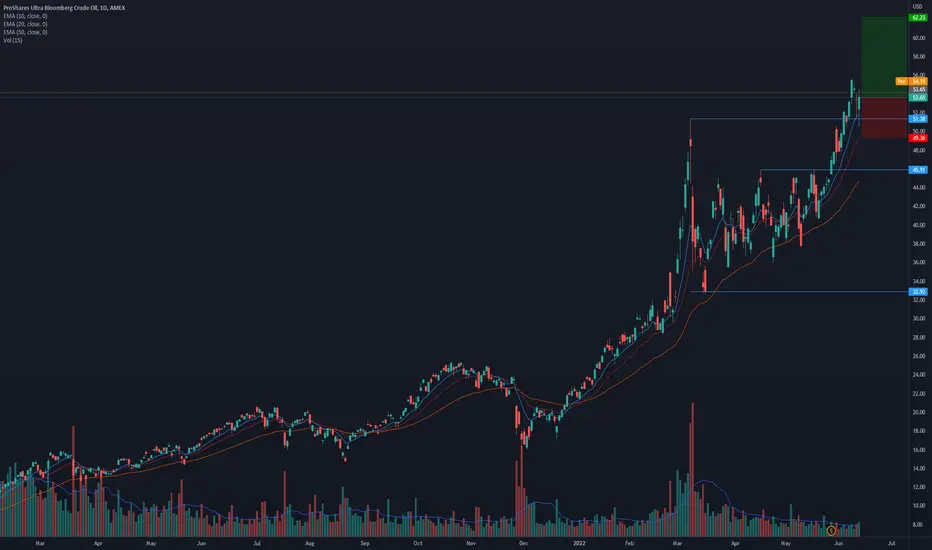
$UCO ready to go higher after retesting broken resistance?Notes:
* Strong up trend due to macro situations
* Printed a Pocket Pivot as it bounced off of broken resistance
* Looks good on multiple time frames
Technicals:
Sector: Exchange Traded Fund
Relative Strength vs. Sector: 3.02
Relative Strength vs. SP500: 4.05
U/D Ratio: 1.62
Base Depth: 56.08%
Distance from breakout buy point: 4.42%
Volume 37.69% above its 15 day avg.
Trade Idea:
* You can enter now as the price just bounced off of the broken resistance with higher than average volume
* If you're looking for a better entry you look to buy around the $52.20 area
* Manage risk accordingly
here is why i am shorting UCO at 180 here is on of the reason why i am shorting $UCO at 180 , first of all ..... look at the graph ...uco had been trying to go over high 180 's 4 times and failed every single time , i think this time we are moving lower down to 150

Bearhish wedge forming in UCOI see a good shorting opportunity in the future around late Jan to mid Feb.
I'm waiting for similar overbought conditions of the indications as circled and a break of the wedge.
Other things too look for is a break of supertrend and movement under hull.
200 day moving average (light pink line) should be strong resistance if it can breakout above the orange line. A blow off top is possible which could present a good shorting entry too.
One thing to watch out for is a possible retest of the orange line breakout and a move higher.

Crude Oil - Buying Opportunity Hello from Genesis Go!
As we can see here crude oil UCO recently fell 37% onto a strong trend-line support presenting us with a great buying opportunity!


Oil to surge on compounding issuesBought shares & calls on this immediately after the explosions in Afghanistan. 3 hrs later Ida was upgraded in the Gulf. And that's just tip of the iceberg with what crude prices face currently. Holding this position through the weekend. Was temped to roll into SPY puts, but OIL the better setup right now...

UCO breakout above 64.5As OIL continues to rise we broke out of the trend above 64.5 and are now in the 65 range (pre-trade) look for a continuation to 75 in the near term

UCO Levels for the coming weeks $75 is the TargetHope you enjoy this brief overview of the UCO Chart as we look to further levels of resistance and support. We are above both the 50 and 200 MA so well within our parameters for upside.

Clean break of the UCO Resistance at $51We have a clean break of the resistance at $51 for UCO and now look for the next level, which is a long way off at $117 range. But we will hold as long as oil production has stopped in Texas and the pipeline system is off-line temporarily.

Important level for UCO is coming upFinally after sitting on UCO for months we are at the resistance level of 38.xx if we can break past this our next target is 51.xx range.
Sitting on a few shares of this always is a long shot but a good chance to get back into oil.


UCO crude oil etf 12/4 target $21UCO is at the top of it’s 4 month downward trend channel. That’s a good spot for a short entry on a crude oil etf. My 12/24 target is $21. US crude oil inventories rose 4.6 million barrels last week, missing expectations for a draw of 900k barrels. US coronavirus cases hit another new daily high record today with 140,543 reported. Renewable energy is where to be long, not this dirty pollution. Do your own due diligence, your risk is 100% your responsibility. Consider being charitable with some of your profit to help humankind. Good luck and happy trading friends...
*3x lucky 7s of trading 101*
7pt Trading compass:
Price action, entry/exit
Volume average/direction
Trend, patterns, momentum
Newsworthy current events
Revenue & Earnings
Debt / Cash
Book value, assets
7 Common mistakes:
+5% portfolio trades
Bad risk management
Emotions & Opinions
FOMO : bad timing
Lack of planning & discipline
Forgetting restraint
Obdurate repetitive errors
7 Important tools:
Trading View app!, Brokerage UI
Accurate indicators & settings
Wide screen monitor/s
Trading log (pencil & graph paper)
Big organized desk
Reading books
Sorted watch-list
Checkout my indicators:
Fibonacci VIP - volume
Fibonacci MA7 - price
pi RSI - trend momentum
www.tradingview.com
