Is Global Oil Demand the Key to Energy Market Stability?In the intricate landscape of global energy markets, the question of oil demand remains a central enigma. Driven by a confluence of geopolitical tensions, OPEC+ production strategies, and economic dynamics, global oil demand is a complex tapestry that shapes the future of energy markets.
Geopolitical events, particularly in the Middle East, have historically been a significant driver of oil price volatility. The recent escalation of tensions has once again underscored the delicate balance between geopolitical stability and global oil supply. As geopolitical risks rise, so too does the price of oil, impacting investors in oil-related securities like the United States Oil Fund (USO).
However, geopolitical factors are just one piece of the puzzle. The Organization of the Petroleum Exporting Countries (OPEC) and its allies, OPEC+, play a crucial role in regulating global oil supply. Their production decisions, often influenced by economic considerations and geopolitical pressures, can significantly impact oil prices and, consequently, global oil demand.
Beyond geopolitical tensions and OPEC+ dynamics, economic factors also play a vital role in shaping global oil demand. The global economy, with its cyclical nature, influences energy consumption. During periods of economic growth, oil demand tends to increase, while economic downturns can lead to reduced consumption.
The interplay between geopolitical risks, OPEC+ strategies, and economic factors creates a complex and dynamic environment for the global oil market. Understanding these intricate relationships is essential for investors seeking to navigate the challenges and opportunities presented by the oil sector.
USO trade ideas

Opening (IRA): USO Oct 18th 64 Covered Call... for a 62.48 debit.
Comments: Adding a smidge to my position here at better break evens than what I currently have on. Selling the -75 delta (ish) against long stock to emulate the delta metrics of a 25 delta short put, with the built in defense of the short call.
Metrics:
Buying Power Effect/Break Even: 62.48
Max Profit: 1.52
ROC at Max: 2.43%
50% Max: .76
ROC at 50% Max: 1.21%

USO to $75MODs have suggested that I provide more detail about the picks I make.
Sorry. I'm not as verbose as y'all, and I don't like things to be complicated.
My trading system is very simple.
I buy or sell at top & bottom of parallel channels.
I confirm when price hits Fibonacci levels.
Bonus if a TTM Squeeze in in play.
I hold until target is reached or end of year, when I can book a loss.
So...
Here's why I'm picking this symbol to do the thing.
Price at bottom channel
Stochastic Momentum Index (SMI) at oversold level
TTM Squeeze just turned on (green dot up there)
TTM Squeeze momentum is spiked down
In at $70.09, out at $75 or when price hits upper channel, whichever comes first

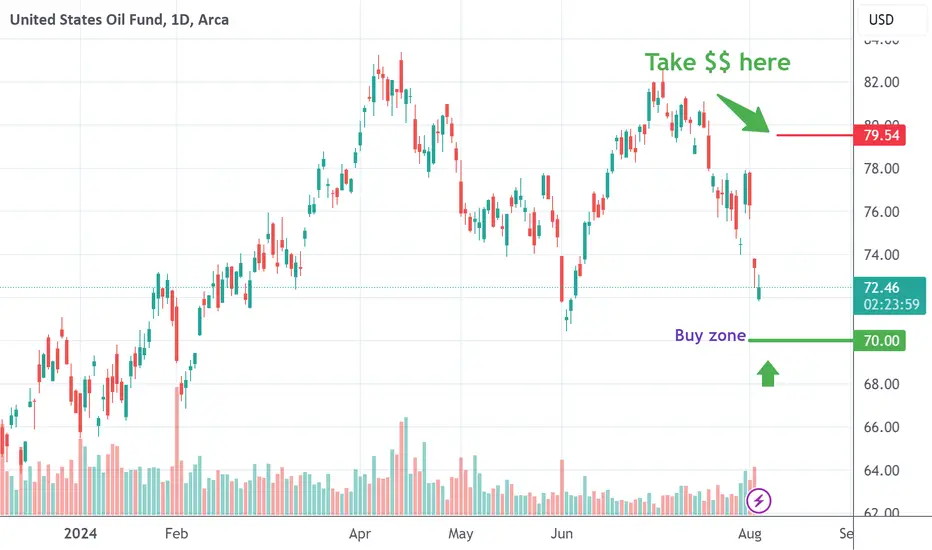
USO another long idea to $79.83The last idea on this was a total winner, so I'm gonna keep at it... I'm getting that it's time to buy it again, but less of a run than last time as the target is just a slightly higher high. This is all based on my dowsing work btw.
The drop this morning should reverse, but may want to fill the gap at 73.39. I have a time of day at 1:40-50. IDK if it'll be the low, or is something else, but it's fun to watch. Regardless, it's likely more up than down from here.
I also keep getting there's news coming & that's in almost every stock I ask about. It said for USO the news sends it up.

Timing & dowsing pick USO longI'm getting via my dowsing work to watch for a spike down and reversal up. I still have a target from a reading last week or so around $69-70 and tomorrow is a calendar date. Often these dates warn of a kind of reversal.
I got 9.8 as a percentage up from current levels, but I'd be aware of where 9.8% up lands from whatever low is made just in case it's off.
This all could potentially occur this week because I got the answer that the high is "for the week", but I wouldn't rely on this at all. Just noting it for journaling.
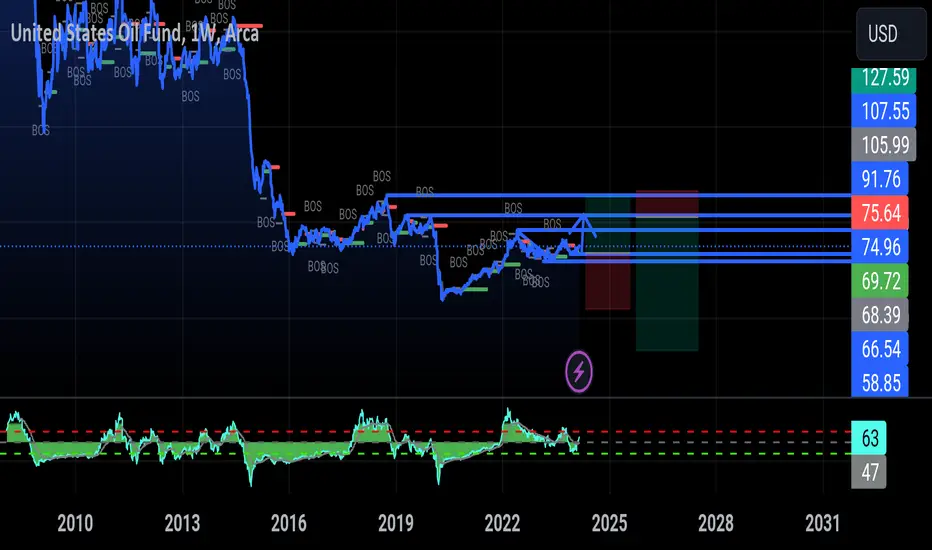
Finally time for bullish oil? $USO to $120 then $300+People have been calling for the oil bull market to begin for the past two years and the trade largely hasn't worked as we've gone sideways to down. However, based on the chart, it looks like we're finally ready for a run.
This would also line up with my bearish equity thesis.
Oil looks to have broken out of an inverse head and shoulders pattern and althought it's a diagonal pattern which are less reliable, the indicators that I have seem to support the narrative.
I think there's a possibility that we could see a 4x move over the next year or so.
Let's see how it plays out.

Oil will fall signaling a recession and bonds will soar!Oil lost the monthly trendline, back-tested it twice now and is ready for the fall. 200ma is flat which means a decisive movement is coming. If oil falls, so will yields - signaling deflation which'll cause the FED to cut rates before the election.
Check out my NASDAQ:TLT thread, I think you could buy OTM calls with that right now, or on AMEX:TMF for August-September and make a killing.
If you're in oil, it wouldn't hurt to hedge right now.
AFTER rates are cut, and the dollar starts going towards 97 THEN oil will blast-off with the second leg of inflation..
NOT FINANCIAL ADVICE!

USO petroleon 2024-2025The price of petroleum dropped from $80 per barrel to $40 per barrel due to a combination of reduced global demand for oil and an increase in oil production leading to an oversupply in the market.

USO Oil ShortUSO on the 60 minute chart is currently in a broadening wedge and reflecting down off a
reversal at the upper resistance trend line. The MACD lines have crossed over the histogram
and are trending down showing moving average convergence. Price is between the mean and
first upper band lines and moving down toward the former. Current factors at play include
an OPEC+ meeting, Russia working around sanctions, increased demand of the summer driving
season, federal rate action projections as well as those in Europe and the ongoing conflicts in
the Middle East. I will short USO here targeting 74 at the bottom of the wedge pattern.

Opening (IRA): USO July 19th 67 Monied Covered Call... for a 65.60 debit.
Comments: Selling the -75 call against shares to emulate the delta metrics of a 25 delta short put, but with built-in short call defense and to take advantage of slightly elevated IV on the call side relative to the put. Would like 30-day IV to be higher here, but can't have everything (it's at 31.2%).
Metrics:
Buying Power Effect/Break Even: 65.60
Max Profit: 1.40 ($140)
ROC at Max: 2.13%/16.90% annualized
ROC at 50% Max: 1.07%/8.45% annualized
Will generally look to take profit at 50% max ... .

USO - Oil Prices are Rising LONGUSO follows the futures prices of oil barrels. On this 30 minute chart, price falls have been
rejected by the POC line of the volume profile and the Lux Algo Donchian channel has
transitioned from downgoing to trending up. The dual TF RSI of Chris Moody now shows
RSI holding above 50 in both the 15 min and 60 min TFs. Net distribution has bottomed out
and accumulation now exceeds distribution. I see this as an excellent entry to buy calls
above the money at $70 or look into shares of USO / UCO/ GUSH ETFs or look at any of
the oil sector stocks including well services which are typically small caps with great upside
volatility with price action momentum. My favorite of those is BORR which currently is trending
up and may have much of its move ahead. The ascending parallel channel of USO is perhaps
a signal for the sector at large.

USO is in a sweet spot on its chart LONGUSO while the middle east, the Houthi rebels and the Suez Canal shipping quagmire affect
oil liquidity globally and prices at the pump continue to be volatile the federal government
seeks contracts to restore the national strategic reserves depleted in the last supply demand
challenge while the presidential and congressional election cycle starts warming up.
On the weekly chart, USO has just crossed over the long term anchored mean VWAP line
as well as the POC line of the volume profile. This is a bullish momentum move. Price is
situated in the middle of the high volume area showing expectations of decent trading volume
and liquidity. I see this as an opportunity to take long trades in oil or anything oil related.
CVX is on sale after a drop after the morning open. i will look at oilfield services stocks, big
oil and oil futures.

USO / UCO a play on barrel oil shock LONGUCO is shown here as a one month trend - It is sitting on the rising support tendline about
2% below the recent high. Oil prices contribute to inflation. Anyone in the USA is aware of
gasoline prices at the pump. Geopolitics plays into price. At present, US Navy warships are
consuming refined oil and heading to the Middle East. Iran and Russia are sanctioned and must
sell oil on the global market ( primarily India and China ) at artificially low prices. If Iran
retaliates against Isreal, its oil infrastructure will be bombed back into the Stone Age in less
than a day or two by the US. Global oil prices will spike nearly instantly from spot oil to
futures. US Domestic producers will benefit ; the insane net cash flow to them will
dramatically increase quickly. Russia will sell more oil to make up for Iran being taken off
supply but will not capitalize so much given the sanctions. The price of oil will likely go
north of $100 USD / barrel and potentially higher. Iran could go nuclear and any residual
oil infrastructure would be turned into a quagmire of scrap metal in another day of work for
the US Navy bombers and the fighter jets that escort them into strategic missions.
Defense contractor stocks will spike as well. This could be a black swan event.
My trading dictates that I add to my positions and average in until price goes against my idea.
I am increasing my positions in gold and silver along with ETFs inversing the indices banks
and financial stocks until the dust is settled. This includes any plays on VIX. I will also look
at individual domestic oil stocks as well as junior precious metal miners.

NRGU and USO/SPY correlatesIntermarket analysis of Oil ETF relative to SPX. This graph works because oil moves based on inflation, economy, commodities etc. Some of these spots were almost "risk free" (until proven otherwise). Meaning 100% - until something changes.
Where are we now? USO needs to find support - and then we see.

OIL a clear invented Head n Shoulders BOTTOMA wave E low is now in place I am LONG OIL in the money calls

USO: Heading down to 200MAUSO (crude oil ETF) is trending down toward its 200-day moving average, coinciding with a previous pivot up within this range and slightly below it. This commodity tends to make dramatic moves so wouldn't be surprised if it made a sudden drop along the way and then bounced, but the channel range may serve as the upper bound. Until it can break free of this sideways or downward price action is more likely.

$USO Oil targets hit. Sideways plus downside, maybe two weeks Breakout was a success and we saw $80s for a good moment there. Plenty of time to have taken any profit on any positions I had. The pullback in between also happened according to the bar chart. Let’s see if the rest of my pattern can make its way through into a plummet for late May.

USO Stock Chart Fibonacci Analysis 042924Trading Idea
1) Find a FIBO slingshot
2) Check FIBO 61.80% level
3) Entry Point > 82/61.80%
Chart time frame : D
A) 15 min(1W-3M)
B) 1 hr(3M-6M)
C) 4 hr(6M-1year)
D) 1 day(1-3years)
Stock progress : B
A) Keep rising over 61.80% resistance
B) 61.80% resistance
C) Hit the bottom
D) Hit the top
Stocks rise as they rise from support and fall from resistance. Our goal is to find a low support point and enter. It can be referred to as buying at the pullback point. The pullback point can be found with a Fibonacci extension of 61.80%. This is a step to find entry level. 1) Find a triangle (Fibonacci Speed Fan Line) that connects the high (resistance) and low (support) points of the stock in progress, where it is continuously expressed as a Slingshot, 2) and create a Fibonacci extension level for the first rising wave from the start point of slingshot pattern.
When the current price goes over 61.80% level , that can be a good entry point, especially if the SMA 100 and 200 curves are gathered together at 61.80%, it is a very good entry point.
As a great help, tradingview provide these Fibonacci speed fan lines and extension levels with ease. So if you use the Fibonacci fan line, the extension level, and the SMA 100/200 curve well, you can find an entry point for the stock market. At least you have to enter at this low point to avoid trading failure, and if you are skilled at entering this low point, with fibonacci6180 technique, your reading skill to chart will be greatly improved.
If you want to do day trading, please set the time frame to 5 minutes or 15 minutes, and you will see many of the low point of rising stocks.
If want to prefer long term range trading, you can set the time frame to 1 hr or 1 day.

$USO Small pullback into wedge, then breakout possible. $88 🎯Continued from previous post. Breakout possible. Wait for pullback into the wedge. Stop on Calls would be below the Box. 4/19 $70 call could pay well if the breakout occurs.

$USO August 23' Rally similar to today's PACompare said time frames and you will see the similarities in RSI and MACD although if it fails, new lows could be on the way. If a B/O occurs , look for $100 sooner than later. Will revisit later. I will attach the next post to this one for continued reference.


Opening (IRA): USO April 19th 66 Monied Covered Call... for a 64.51 debit.
Comments: IV of 32.3%.
Selling the -75 call against a one lot of stock to emulate a 25 delta short put with built-in short call defense.
Metrics:
Cost Basis in Stock/Break Even/BPE: 64.51/share
Max Profit: 1.49
ROC at Max: 2.31%
ROC at 50% max: 1.15%

US Oil trading planFirst of all before I follow the trend I check what kind of trend is this, soo that is gonna be easy for me to get into position, US Oil is a down trend market however a down trend market does goo up n down, soo there is a short buy to 91 n 105 coming weeks before another leg down, before you can analyze find trend always, investing n trading is going to be easy n give you power to hold negativity if you enter wrong entries, you gonna be knowing we're market is trending beside short movement,find a real trend n check previous years make sure you are following right trend📈📍