USO trade ideas
USO Ichimoku Buy SignalsOn the 1 day chart, price broke above the triangle pattern and is trying to cross above blue base line. The lagging line is also attempting to cross up over price. Last, the 50 DMA is trying to cross up over the 200 DMA. Thanks for viewing my chart. I'm new to charting/trading, so any corrections or help would be appreciated.


Going long. to go or not to go?I have been recently watching United States Oil Fund's 6 months, 1y and 5y chart and they all say the same thing. go long. any thoughts?

USO - Support around 10.90Looking for USO to strengthen around 10.90 where 50, 100 and 200 ma confluence exists. Also trendline support.

Uptrend Intact Despite False BreakoutPrice has recovered considerably since being rejected at resistance on January 3rd. The current trading channel remains valid, as well. I am looking for a retest of resistance on price in addition to the new resistance trend lines on RSI and ROC. Of note, the MACD is turning positive, too.

USO Breakout Rejected at Resistance Trend Line- Indicators BleakPrice briefly pierced resistance, although, this was promptly rejected during the US regular session hours. Concerning indicators, the RSI uptrend appears to be broken to the downside- same with the ROC uptrend. Concurrently, the MACD just turned negative. My short-term price targets are $10.90 and then $10.50.

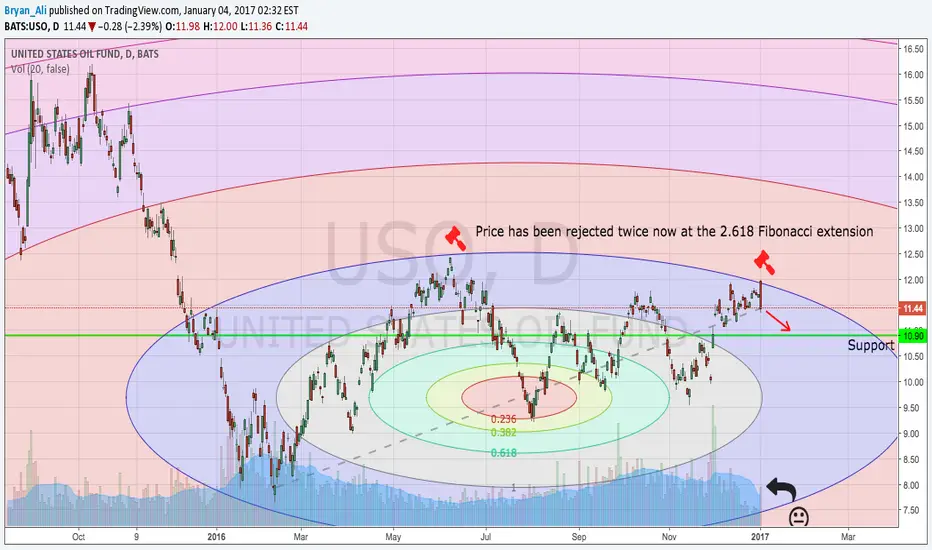
Fibonacci Circles: Price Rejected at 2.618 Extension, AgainThe USO trading price has been rejected (on large volume) for a second time now at the 2.618 Fib extension- with the first rejection occurring in June of 2016. Next area of support is around $10.90.
Our ETF Trend Letter subscribers love this setup in $USOwe are nicely positioned from lower for this breakout


USO Short Term LongWe saw a gap down on the open today. Regardless, buyers were still willing to come in and drive the price higher. I think this is a good opportunity to squeeze out the people who got short positions in early on what appears to be a top forming.
Be prepared for a gap up on the next open. In which case, I still wouldn't be afraid to open a position up. Looking to get long once the MACD crosses upwards. My stop will happen if the MACD crosses back downwards.
I would look for a target price of around 11.90 - 12.00. I would not be looking to hold this for more than a few days.

USO Medium Top Forming (Update 12/06/2016)Medium term traders shouldn't be shorting this yet. We still have positive momentum on the MACD. Also, I think it's a bad sign to see buyers willing to come in and drive the price higher after a gap down today. I think this still needs more time before heading down.

USO Medium Term Top Forming Update (12/05/2016)A top appears to be forming on USO but medium term traders should not short yet. Looking at the MACD we still see positive momentum going on. It is safer to wait until we start seeing the MACD cross towards the downside before we look to short this.

USO Medium Term Top FormingLook for price to hang out in the price range box for several days before moving down. If you want to open a position towards the top of the price range box that is fine. Personally I'm going to wait for some sort of failed breakout towards the top of the price range before getting involved on the short side.
I'm giving two target prices to close your position on. Personally I would close out about 20-40% of my position at the first target price, then look to close out the rest at the second target price.
Good Luck

USO/Crude Oil Could be Completing a Horizontal TriangleTwo months ago both USO and Crude Oil appeared to be forming Horizontal Triangles from the February bottom.
The pattern was subsequently validated.
Now the possibility of a Horizontal Triangle has reappeared.
If USO holds below 11.79 it will remain valid.
A break over 11.79 will invalidate the pattern and opens the door to reach at least 12.45.
MACD lines are bullish implying at least one or two more up days.
The Weekly Crude Oil futures has a different pattern and needs to rally at least .14 points for completion.
Watch USO and Crude Oil,a great shorting opportunity could be just days away.
Mark

USO moves in relation to oil's $50 markI say, trends in silly moneymaking funds like USO and UCO, UWTI, etc are a great way to get rich, but as my great grandfather said and his great grandfather before him, "Always know where $50 is."
This chart is meant to show you exactly that in relation to USO.
Why does USO do this funny little contango dance around oil? Why, that's for another post my boy!

USO 1yr 2hr wedge range bound continuesLooks like we can take another stab at the range bound wedge run.
It is getting fairly tight - faked out once so far to the downside. Lots of volume on here and usoil futures, could be indicative of a bottom for the down trend, not going to look too deep into it since we know how many bs contracts are open.
Possibility of a rough head + shoulders which would confirm the range bound price action. Setting up a position short here earlier than shown ~10.93 then will add on as shown in the chart.

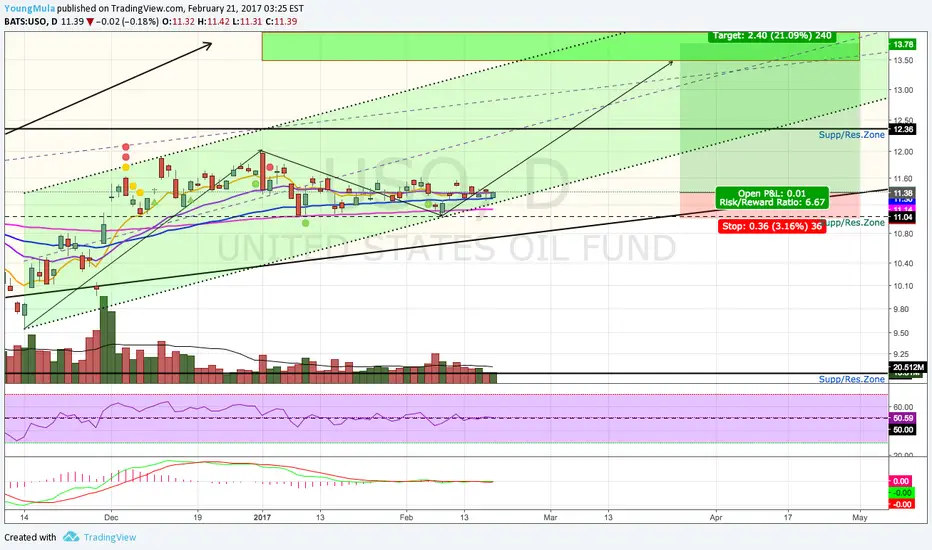
USO - Staying bullishFigured I'd update this USO chart with a new target (#3). Unfortunately Energy-related stocks didn't pull back as I hoped when USO nipped at target-1. However, hopefully the target-2 area will allow them to consolidate before moving higher again.

USO Long After Slight PullbackUSO is in a shorterm uptrend and could continue up to around 11.38 within the next several days. I would look for a slight pullback and buy on strength around the 10.60-10.70 area. Stop would go around the 10.50 area.

USO - Adam Smith Moving Average Cross StrategySimple Moving Average strategy for USO - United States Oil Fund. This strategy can be used on stocks and currencies but will need to tweak frequency on chart and backtest Max Draw Down to Net Profit ratios for maximum dollar gains.

USO - Guess on short-term directionHoping for better entry on some energy-related stocks. Maybe timed with a pullback on USO??? Purely hypothetical.

USO 2hr 1yr downside wedge breakoutFor the long term I am absolutely long crude + us oil companies due to fundamental reasons but the chart at the moment looks like it is about to breakout down. I have already a short built from ~11 but this is a new trade to play the breakout.
