USO trade ideas


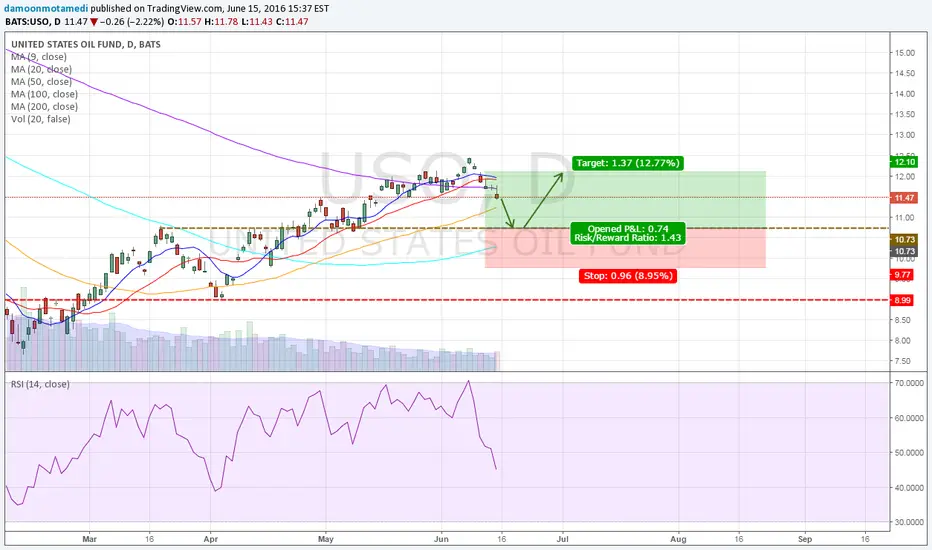
USO at 200DMA, observing resistanceDefinitely bearish feelings here, $DXY has found support the past week and along with the small recent USD rally we find $USO has run up against the 200DMA.
The 10DMA (drawn in blue) has provided support in the past, so waiting for a break down there would be wise IMHO, although I suspect we're about to roll out the red carpet soon.
The previous oil chart I did calling for a short bounce lasted longer than I suspected, as $DXY has been weak since the beginning of the year and has just started to find something that resembles strength.
Thanks for reading, good luck to all


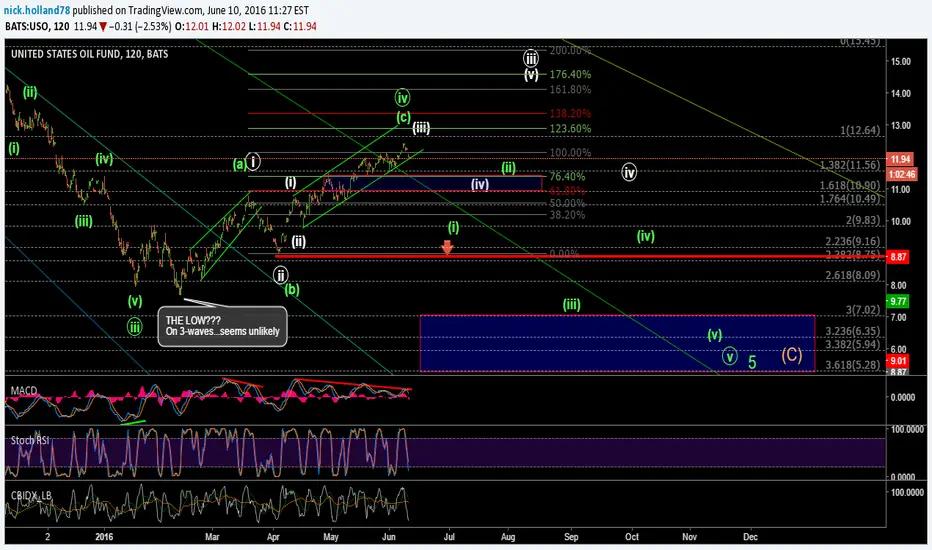
USO - 4hrMonths ago I'd posted skepticism that THE LOW could be seen on 3 waves in Feb. Since then, price has continued higher than I'd initially expected for the green wave iv. The green count is still valid - and last week I exited a swing short from near the June top. Given the time spent consolidating instead of breaking lower in a presumed green wave (iii), I'm again considering the possibility of a Leading Diagonal (which assumes THE LOW was seen in Feb).
Contemplating a long trade IF price holds over 10.18 region (micro count allows for one more low below 10.51 but its note required). The next rise should be corrective as prescribed by a diagonal - something like the (a)-(b)-(c) in v of 1 (white count). Could be a difficult trade, so I'll take it one move at a time. Strong decline without breaking back above 11.12 would be an indication that the green count is continuing.


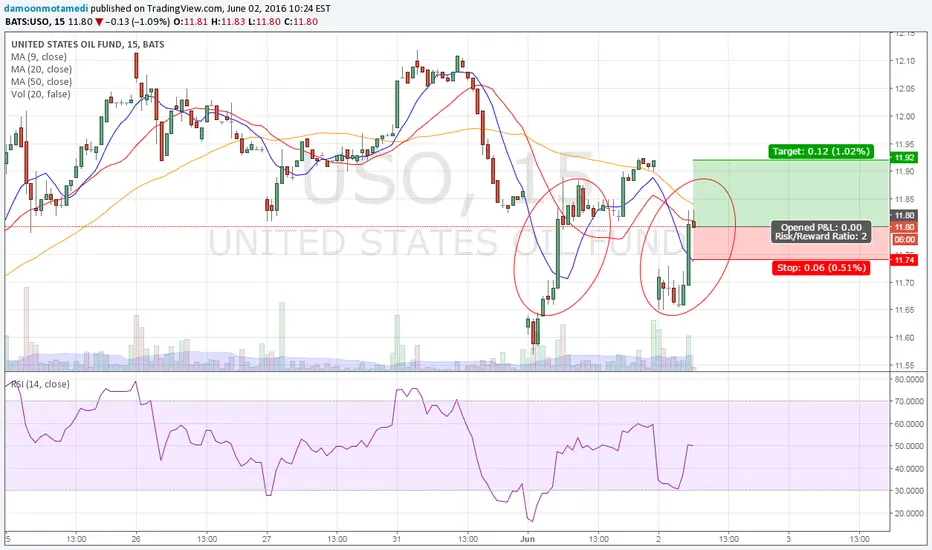
Pitchfork breakdownI don't use pitchforks normally, but I saw one could be set up pretty easy on this chart and it's having a nice break down and out of the indicator.
the 12.50 pivot was a also a previous support pivot last August.
I could see the next major support being provided around the 100DMA


USO - 2hGiven negative divergence on technical indicators, I took a short positions on USO and /CL earlier this week near the high. USO *may* have stopped below the 1.00 extension (12.64) of green minor waves i-ii. This would support the green iv-v of 5 of (C) <7.02. A corrective decline, however, would suggest the white bullish count could continue. This negative divergence isn't characteristic of a 3rd wave, so I'm cautiously short.
Almost hit my 18% goal. Risk increases into resistanceEarly May we discussed that bulls were attempting to absorb supply and that prices should breakout and test the next level of resistance near $13.00. It has been a great 14% trade; however, cumulative demand is contracting. It does appears to be worth the risk of giving profits back. Anticipate we will start to see some liquidation to protect profits and reduce risk.