USO at 200DMA, observing resistanceDefinitely bearish feelings here, $DXY has found support the past week and along with the small recent USD rally we find $USO has run up against the 200DMA.
The 10DMA (drawn in blue) has provided support in the past, so waiting for a break down there would be wise IMHO, although I suspect we're about to roll out the red carpet soon.
The previous oil chart I did calling for a short bounce lasted longer than I suspected, as $DXY has been weak since the beginning of the year and has just started to find something that resembles strength.
Thanks for reading, good luck to all
USO trade ideas


USO - 4hThe green count to new lows has been my preference, but this has been a difficult trade lately. Today's rally would be wave ii of wave (i). Alternative count shown in pink interprets today's rally as wave b of (a) in a wave ii. Above the March high the more immediately bullish white count seems most probable.

Flag break out usoOil is starting to look better here looking for a break out next week to fist target zone 11.50
happy trading

Looking for entry in USOThese are my targets for possible points I'm looking for. Monday and Tuesday could be down going to remain cautious.


USO - 15mMy primary green count looks like a bust, and is completely invalid over USO 10.80. The purple alternative is my new primary expectation, although the non-overlapping Leading Diagonal (albeit rare) as shown in white is also valid.
I plan to exit remaining shorts on a purple iv retrace.

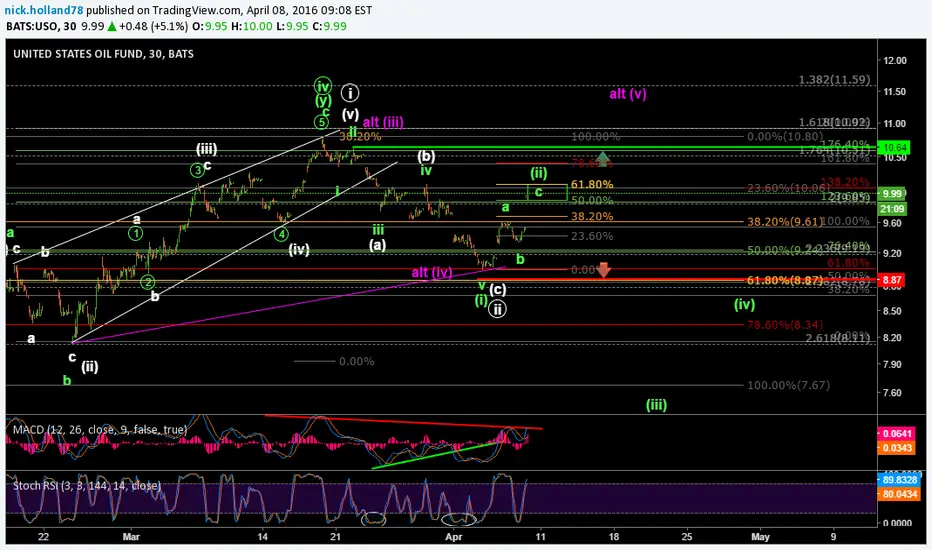
USO - 30mHere's the USO picture to accompany linked idea. Over 10.64 I'll be out of shorts, though the green (ii) doesn't technically invalidate until 10.80 breaks, it is becoming increasingly less probable as price pushes higher. The green target box at 50-61.8% retrace is a standard expectation, but not necessary for price to turn there in the Elliott Wave pattern.

USO - 1hrZoomed out to put move in perspective. Waiting for re-entry on shorts in wave (ii) target box.

USO - 30mYesterday I took partial profits on short entries from near the recent top in high 10s. I plan to reload shorts in wave (ii) target region. Wouldn't be surprised to see my Parabolic SAR tripped, only to have price turn down again below the new signal line for lower at 8.95. Ultimate targets remain sub-7.

Watch Oil for Market DirectionI'm really watching the oil markets right now because it seems to be influencing the overall stock market right now. Just when you think oil is declining and the markets are rolling over, it appears that a bull flag is forming on oil and the markets look like they could continue to rally. There seems to be too much short interest in the overall market so there is a 50% chance for bulls and 50% chance for bears to take over the stock market. Learn more about risk taking by visiting www.tradertraininghq.clickfunnels.com
I've developed an online test to determine your trading IQ. Visit www.tradertraininghq.com and take the test. Let me know what you scored!


In for further weakness..Good possibility for further weakness. Target is towards the lows. Will be using tightening stops for the trade given the potential of a trend reversal on any sharp downward movement.

USO - 30mNear-term possibilities outlined in Elliott Waves on the chart. See previous ideas for more info.


USO - On it's way to the centerlineIt's really astonishing how the ancient rules of Action/Reaction work out.
Newton was a REAL genius.
Next stop - Centerline.
P!
mytradingcoach.teachable.com

USO - 15mImpulsive bounce from 8.97/8.87 would be a warning to shorts. Strong break below 8.87 points to 8.53/.25 or lower. USO has had some extremely extended 3rd waves over the past few years, so catching this knife (looking long) is ill-advised. Long traders need to see a 1-2 bounce set-up off support in order to establish both a probable potential trade target as well as an invalidation stop below start of presumed wave 1.

USO - 1hKey inflection region on USO. About 4% from making the bullish (white and purple) counts extremely unlikely imo. White count revised from earlier posts; purple count represents the old white. Embedded Stoch RSI suggests green wave iii to new lows underway.

USO - 30m9.48 signal level is broken. Some variation of the light blue count to new lows may be playing out. The red count COULD still be operative as an expanded flat - resistance remains as annotated. I'll get some Fibonacci measurements on smaller degrees posted later, but check the linked hourly idea for perspective.
