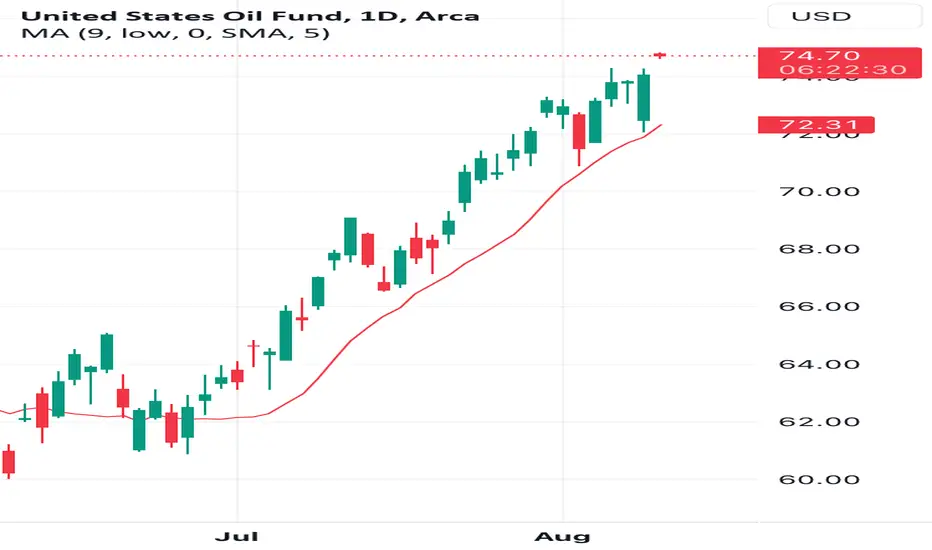
$USO Double Top Since August 23, AMEX:USO has been on a consistent upward trajectory, forming a Double Top pattern. Given this technical signal, it may be advisable to either sell call options or lock in some gains. In technical analysis within stock trading, a Double Top is a bearish reversal pattern that signifies a potential change in the trend from an uptick to a downtick. The pattern is characterized by the formation of two consecutive peaks that are roughly equal in price, separated by a trough. The pattern is confirmed when the price falls below a support level, typically represented by the lowest point of the trough between the two peaks.
In a Double Top pattern, the first top is usually created with strong buying pressure that pushes the asset to a new high, but eventually, the buying momentum fades, leading to a moderate decline, forming the trough. The asset then rises again, driven by optimism, but fails to surpass the first peak, forming the second top. At this point, the inability to break the previous high is a sign of waning bullish momentum, suggesting that a reversal may be imminent. Traders often look for a decisive break below the support level as a confirmation to enter short positions, with the expectation that the asset will continue to decline.
USO trade ideas

USO - whoa!It is rare that a market that has achieved more than a 4:1 containment ratio will continue without a retracement. USO 15 days over the 3 day MA of lows. Let’s watch for a correction next week.

#USO STRADDLE/Trade PlanUSO Traders pay attention to this option sentiment/strategy
The biggest one for USO we observed up to now.
Based on our team's research of the options market, we expect buy activity at the support level or sell activity at the resistance.
We primarily consider levels to be activity zones, but not to be a super-fine level for establishing a limit order. Use them in combine with your own strategy.
We do the best research as we can to find new opportunities in the massive amount of information every day to help you make data-driven trading decision.
Please feel free to leave any comments you have and like this idea if you agree with us. Any feedback or comments will be read. We appreciate it all!

OIL STOCKS leading CRUDE OILWhat do you mean by a spread? A spread is a difference between two similar markets, in this case oil stocks and oil service companies versus the basic commodity that those oil companies trade in, which is crude oil.
There is a substantial trade set up at the moment that presents large returns with a reasonable amount of risk. Shorting Energy Stocks using the $XLE ETF and going long oil with the $USO ETF.
In the last two instances, it was $USO that was leading higher without $XLE to support the advance, and $USO collapsed to close the spread. See chart enclosed above.
Why does this spread exist? We can point to political promises to "end the use of oil" that forced investors to reconsider the long term valuations of oil stocks. Investors don't typically "own oil" through oil futures, rather they own "oil in the ground" by way of oil companies.
Risk $5-$10 in crude oil and 5%-10% in $XLE roughly. If one market moves more than 5% then we can look to increase the position and tighten the stops to break-even.
There is no specific 'catalyst' to drive this pair back together at the moment. If the economy opens back up globally, then oil demand estimates will rise and cause people to buy oil futures. Opening up could also drive energy stocks higher too due to very high margins currently in the processing of crude oil into their refined products.
The only risk in life is taking no risks. Nothing is without risk. Holding cash leaves you to be exposed to inflation and the loss in purchasing power. The rest of the disclaimers are standard legal ones. I have no positions in this trade yet, but will be considering them.
A good way to manage risk is to use options in the form of spreads on both sides of this trade to define a maximum amount of risk in advance. Buying a call spread on $USO and buying a put spread on $XLE would serve to manage risk intelligently. The duration of this trade should be 3 months at maximum.

USO - NO NO!5 days above the 2 day MA of lows and above the 3 day MA of medians. I know what I am looking to do tomorrow/Friday!

USO - shortIt looks like WTI crude oil futures will close up today. That will be the ninth consecutive day that they are rising. In the last 23 years that has happened on only 8 previous occasions. In all but one of these 8 times, crude oil snapped the winning streak the following day. The mean return for all 8 occasions is -0.9%.
I am going short USO as a short-term trade, expressed through put options, which I expect to close by the end of the week . I don't have a precise price target, but I am looking for something around 77. I'd take a loss on the trade if USO were to close above this week's high above 78.78

USO hit upper target. New target $74When targets get hit, it's often a chance to play the reversal. I had today as a short opportunity & the guidance from my dowsing is this is a reversal/scene of the crime kind of play.
The target is around $74.
I was also guided to get a date, which comes in on the 15th. Dates can, and often are reversals, so maybe we hit the new lower target by, or on that day.

Long entry on USO $72My attention was draw this morning to suggest a potential daily low on USO. My dowsing said to look for multiple days up after a "pop and drop" & "drop and pop" scenario today.
It also suggested this idea may take a couple weeks. It's really gonna have to dump today to hit the level, but I'm just going to give what I got.

USO4:1 containment ratio. Watching for a hard break through the 8 day MA of lows. This is a rare metric I might get preemptively short before a break.

USO - whoa!26 days above the 8 day MA of lows? C’mon people. That’s not going to hold. Let’s see how sharp and long the retracement is.

USO - take it slow!Looks like a blow off top. 3:1 containment. Those long now beware. Consider a short now and or on a break of containment MA 10 day MA of lows.
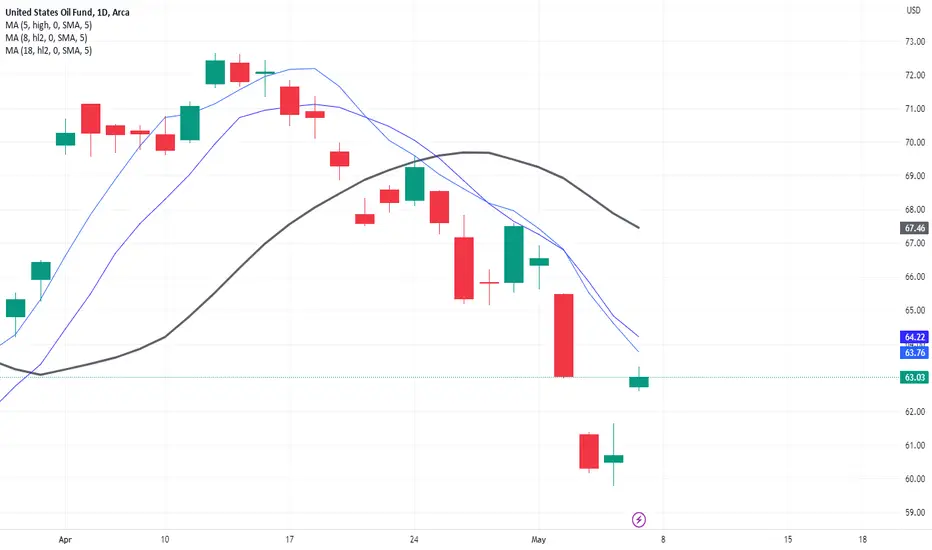
Daily timing on $USO target 68.50ishI wish I had posted the work I had on this thing for the bullish move up from the 17th, but here we are at a date my dowsing gave me and a nice move up right into it.
I expect there to be a 5 point retracement and target is $68.50.
There could be another little pop on it, but it's a sell. I'll look for another date later. For now, it should go down as dowsing said "continues down", "trade entry", "waterfall", "new weekly low", "end of bull market". The last one can mean just temporarily. Now you know some of the attributes of my work. Let's see what happens!

USO - here we go!3:1 or more containment ratio. Had a break but probably not done. I’ll watch for break of 8 day MA of lows to short. Maybe not more than a day or two but I’ll take what it gives me.

USO - ouch at the pump!Well here we are at a 3.5:1 containment MA. Retracement soon likely. But remember a lot of the time just a quick retracement and continuation. Those shorting should not get married to the short position!

USO - up up and ???Blew through the 64 area zero slope MA. 71 area maybe the next equilibrium price area as that is the next zero slope MA up. Let's see what kind of headway we make and how quick over the next few weeks.

USO - which way will it go?Nearby upside pivot band. Distant downside pivot MA. Will still follow distant downside pivot. Some really bad economic numbers or other softness maybe we get a downside break. Certainly the proximate upside a possibility this week or following.

Oil - consolidation, higher or lower expectation?Well USO is trapped between containment MAs and beyond them release MAs (the furthest away MAs that can be drawn with respect to proximate price action). I'd take any of these signals in either direction. Let's see if this week offers clarity.

USO - right between the cycle pivotsUSO right between the short and long cycle pivots. Let's see what provocation we get to nudge it one way or another. Supply side shock? War? An unexpected number maybe Friday morning?

USO TOOK PROFITS ON MARKET ON OPEN TODAY The chart posted is now into over res at .382 and a 50 % from 64.90 to 65.30 I went 90 % net long at 60.00 even and now have exited the trade . Also my view in the spy and qqq was to have a nice peak due may9Th so I am nearing a major shorting position I just need a few hours in my models . best of trades WAVETIMER

USO - any provocation or none2:1 containment ratio with the MA of medians and 3:1 containment ratio with the MA of highs. The cycle median is about 3$ higher. I'll be a buyer preemptively and on a break higher as well.
USO - deja vu again?With USO down near where it was when OPEC throttled supply recently, will they do it again or something even stronger? With USO 11 days under the 8 day MA of median prices, a > 1:1 ratio, I am paying close attention to this market.

USO - up or down?Caught between the 30 high and 13 low MAs (zero slope) we will perhaps find direction sometime this week. Would take the trade either way.

Broad Markets Overview 20230421Better descriptions coming soon!
Apparently I need a longer description, this is from my live stream today.
