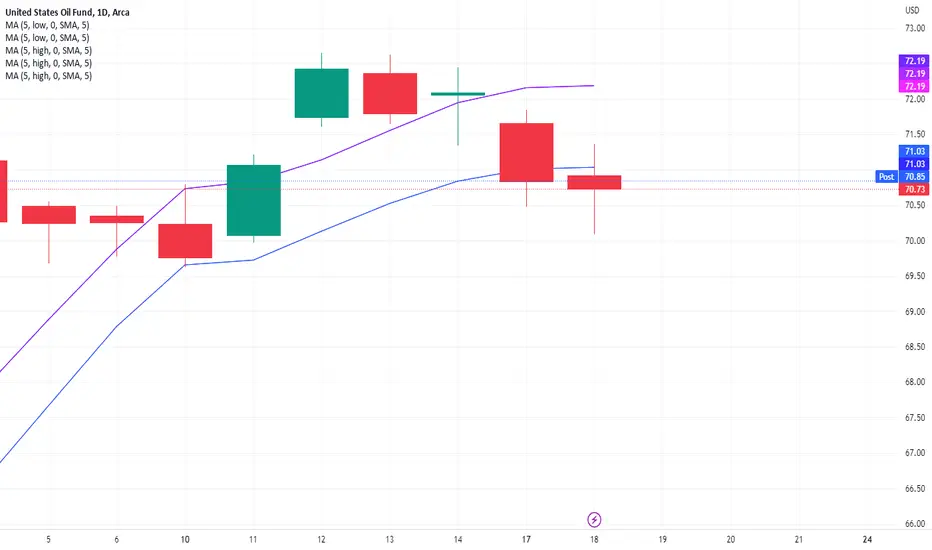
USO presents 2 higher pivotsUSO horizontal 5 day MA of lows and envelope limit 5 day MA of highs point out two higher pivot levels.
USO trade ideas
USO (CRUDE) Bullish Bounce... something is up!Previously, it was observed and expected that Crude was to bounce. Instead, Crude made a dive down and out of the boxed range. For a moment, took a second take on the analysis and decided that it might have been a bit before its time, since the longer term pointed to two trends; crude to go up and USD to go down.
So, a chance came when USO triggered twice in the 15min chart ( system alerts set based on 15min intraday chart as a personal standard ).
It was a calculated risk and probability count.
USO/Crude had oversold, bounced off a couple of times, and broke our of a short term trend line. The Daily chart had a range breakdown, followed by long tails for the previous three days. It appeared to have a good probability of recovering.
A position was taken (USO 50 delta Call).
From there, we can observe the volatility (and hence you prefer to be in earlier and smaller position) and the development of the trade in the daily chart shows the opening of gap ups and closing of gap downs.
Furthermore, USO / Crude broke back into the range. And for such failures that recover and break back into range (orange and/or yellow box), there is a high probability of breaking out the other end. And yet other observations have the Fibonacci retracement bounce off the 50% to project a near term target of about 65.68 (150%).
All these are encouraged by the previous day's candlestick as Monday's candle gapped up and closed a previous gap down, and ended the day very near to intraday high. Daily technical indicators (MACD and VolDiv) have crossed over and are starting a bullish alignment.(Noted that the breakdown out of the range did have a VolDiv bullish divergence that was very obvious, an early suggesting that it was going to bounce and recover.
Going forward, USO is starting to be overbought, and a possible pullback to head up further to near term target is expected. Could be more bullish or otherwise more bearish. but am expecting the range support to hold better this time.

USO: Forest Bathing 🌲🌳 🌲🌳Forest bathing can improve mental or physical health, as spending time in nature can reduce stress and pain and boost positive mood. The United States Oil Fund should take this to heart and set out for the lush composite consisting of the turquoise zone between $52.24 and $43.83 and the green zone between $46.36 and $40.29. Therefore, it should drop below the support at $63.00, which should provide further downwards pressure. Wave 2 in turquoise should then ideally finish just before the support at $45.30, changing into upwards movement afterward. It is also possible, though, that USO could climb above the resistance at $72.22 to expand the last low in the form of wave alt.b in orange first before heading downwards.


USO needs to bounce today or tomorrow or drop will be strongUSO was in a huge bullish pattern falling wedge. It break out of it several days ago but it simply can't move up further. If it drops inside the pattern it will be a dead hook or fake breakout and could be very bearish and fast. Volume on the drop confirmed price action which could be bearish for oil.
RSI is dropping but is still in a neutral area.
MOCD drop below the zero line and does not show sign of moving up.
Overall: OIL need to bounce today and break again from the trend line otherwise could be seen a nasty and strong drop. After its breakout the first time it found resistance at a high from December 2022 and wasn't able to move above it which is bearish for sure. It could find support on the blue trend line, but that support won't be for a longer time. Because of that it s got a sell signal which will be removed only if the price moved out of the falling wedge asap.

Head & Shoulders Top Completed, USO/SPXAccording to TA rules, the ratio has completed the pattern with a Complex Right Shoulder (two peaks).
Those these means that the SP:SPX should breakout from that downward trendline? I don't know, but probably.
Or those it means that energy stocks should finally follow oil prices? Maybe, it is what normally had happend.
What I'm seeing is more stocks going up, even though some breakouts aren't working as smooth as it should.
Nontheless, I just follow price.
This ratio is just another indicator, let's wait and see what happens.

USO: Rollercoaster 🎢USO got a wild ride ahead! We're expecting the course to drop further below the support line at $63 to finish the green wave 3 before rising up again to complete green wave 4. Subsequently, the trend should continue to sink into the turquoise trading zone between $52.24 and $43.83 in order to end the correction with the turquoise wave prior to heading back North and leaving the target zone.

USO (daily)(irregular flat towards 60.15 by 12/15/22)in this count is the irregular flat that breaks below support and than the herd rushes in after getting stopped out

USO (daily) (single ZZ towards ATH...3/22/23)this count gives us the possiblity that a single zig zag towards ATH round the end of March 23'

Watch for Reversal in $USO /CLMy dowsing has today (11/18) as a date for USO, /CL. It's pushed into my first target and when I get a combo of dates with a price target, there's HIGH ODDAS a significant retracement occurs.
Today was expecting to be down 4.5%, but I get to be short all day is profitable.
On the upside I get there is a 6 point move on the table. I may buy calls today or Monday. Dowsing says there is a long entry close.

USO to 89 in timemultiple harmonic patterns inside of each other that provide the structure for upside
indicators bullish with room to run
momentum clearly shifting here on oil
democrats getting voted out next week
liquidity grab from yesterdays biden announcement (you panic sell - they fill their orders and fill them cheap )
trendline breakouts etc
add on pullbacks
t1 2.4 reward/risk
83 / stop at 69
t2 3.75 reward/risk
89 / stop at 69
tracking recent trades
1-0 / +1.6% / SPY
will update this post when i exit this position

USO to 50 - USOILHead and shoulders on USO (proxy for USOIL) says 50 is the target. After creating a strong head and shoulders pattern, we came back slightly above the neckline - typical overshoot. Now we're making our way down again. Bounce in oil is likely over. This idea is incorrect if we get over 81.

Head & Shoulders top on USO/SPX?The Covid Crash was like a reset on all assets and ever since, AMEX:USO has been outperforming the SP:SPX .
The ratio peaked on mid-June and it looks like is actullay forming a head & shoulders top.
This is bullish for stocks as I think the indexes already bottomed (in mid-June). But remeber, is not confirmed until the breakout on the neckline happens.

Breakdown in oil Short term breakdown in oil is almost here, this will reverse and turn to the upside sitting at $150-$200 per barrel. Yikes get ready in a couple months.

USO - Crude Oil weakness. Seasonal playSeasonal favors downside in crude oil. Market presented a new setup.
IQ has always and will always, get all the praise; but discipline gets the job done ~Mark Ritchie
Lose like a pro and keep trading, or lose like a novice and quit ~Mark Ritchie

Long Oil ($USO) - Macro and Technical ConfluenceI long'd $USO at $71.70 after it held support with a nice liquidation grab just below the 50DMA. Heading into the winter with ongoing war in Ukraine and severe global energy supply shortage plus logistics issues, now technical confluence on the charts. I'm expecting it to test the $120 resistance again at least, if not blast through to $200+.

Short 10 year - Long Oil Another interesting one - oil breaking the correlation with 10YR , trade bets on the convergence of the spread but offers as well protection against geo political turmoil (oil up , 10 year a safe heaven) and exposure to a market pivot thesis as the long term narrative should adjust faster than the short term (oil). Inflation narratives that can be perceived a risk for long term growth can further open the spread which is the risk to this trade. Correlated with a long equity position -

Crude oil making another push against resistanceUSO (largest crude oil ETF) has been in a wide trading range for the past 2 months between 71 and 79.
It's failed at all previous breakout attempts, but the more it tries and the longer this range carries on, the more likely the breakout becomes. No trade yet, but we're watching this zone to see if we can finally get some price expansion and volume on a move over 79.


decision time for OILOil has run into overhead resistance at the 50 DSMA after an impressive 5 day run off the most recent lows. Does it now cower in the wake of a hawkish Powell at Jackson Hole later this week, or does it say Come and Get Me, Big Guy?!

USO is done. Peak Inflation and Recession will close it.CPI data tomorrow will crash Crude tomorrow and keep it going on a downward spiral.

Money is the root of all evil. Oil is the root of all inflation.$USO nice bounce of the 150-day and breakout through the first Fib retracement level on the daily. Looking for positive momentum over the next few weeks. This will kill the #bearmarketrally soon enough. Powell chickened out with 75 bps.

Is #USO Breaking Out?Is #USO Breaking Out?
# Crude #oil extended last weeks Friday’s positive close in trading on Monday as U.S. President Joe Biden’s visit to Saudi Arabia failed to deliver anything concrete. The trip was aimed at coaxing the Saudi’s to increase oil production thus easing inflation pressures. The response from the Saudi’s and other key officials reiterated the fact that production scheduling and/or increases remain with the OPEC+ consortium leaving President Biden without a deal.
Sorry #JoeBiden
