$V$V with a nice breakout back into the channel...vol shelf lining up nicely - top of channel: let's go!
NYSE:V
V trade ideas

Cup & handle pattern. I'm right?Looking to see if this pattern plays out. The prevalent analyst and expert consensus on Visa is Buy with 19 strong buy estimates. The prevailing projected target price is 270.26 with 23 professional opinions

VISAHello everyone, the price is circulating in a transverse channel between the two levels
(195.88-235.97)
I see the stock has good buying opportunities
at the next levels
211.26
208.09
200.08
191.72
If it closes below the level of 216.26
So that the following levels are to take profits
211.67
216.38
222
225.26

IntcHello friends !
The INTC campaign begins its journey and now we are in the testing phase of the climate action

Bullish visa Hello traders,
After banning visa and Mastercard in Russia, it was suffering a bit but the impact isn’t that high. So we see this as an buying opportunity.

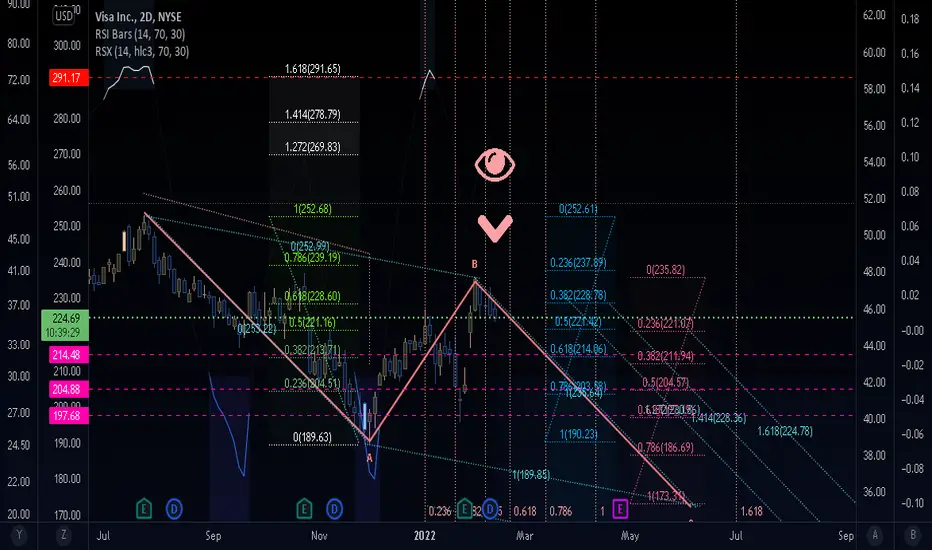
Visa running out of credit part 2. VImmediate targets 214, 204, 197. Invalidation 291.
We are not in the business of getting every prediction right, no one ever does and that is not the aim of the game. The Fibonacci targets are highlighted in purple with invalidation in red. Fibonacci goals, it is prudent to suggest, are nothing more than mere fractally evident and therefore statistically likely levels that the market will go to. Having said that, the market will always do what it wants and always has a mind of its own. Therefore, none of this is financial advice, so do your own research and rely only on your own analysis. Trading is a true one man sport. Good luck out there and stay safe

Long trades are easy if you time your entryHere is V (VISA) chart the price is coming into a strong DZ(Demand zone) untested sweet DZ, and its from the long-term (M) chart, so even better. the weekly chart (W) where i took the trade was correcting (hoping) into this DZ. if the DZ holds the price action was indeed a correction & the long-term uptrend on the (M) will continue. if the DZ fails to hold, well technically the (M) is a downtrend and am looking for a tight Short on the higher price retest. thats how trading works. go with the flow of the price. your trading strategy is to be an instrument of the price. dont have any feelings to the stock. dont form an opinion as if you know #whatsthemarkerdoing today. have no opinion! learn to listen to the price & ride it. like riding the waves, or learning to sail with the wind. dont force a trade! a sailboat can not sail directly into the wind. so be the sailboat in the wind & your trading will work
WHY I TOOK THE TRADE
Long-term(M) in uptrend
trade chart(W) in correction to DZ
*the DZ is also the last HL of the (M) uptrend. if it holds the (M) will continue
its uptrend (technically)
ODD ENHANCERS
- Strong DZ
- untested DZ
- over supply into DZ
- current chart (W) in correction while
longterm chart (M) still in uptrend
CONFIRMATION
Strong Hammer candle stick in DZ
WHY I CVRed
- the rebound from the DZ is weak & loosing
momentum in the smaller chart(D)
The trade did not go as expected & the DZ did not hold. I respected my PT
(Profit Target) & still made 28 points per share.
thats $28 dollars per share. not bad for my trade budget

Russia has imposed sanctions against Visa and Mastercard !Russia has imposed sanctions against Visa and Mastercard . Starting from March 10, Visa and Mastercard payment systems stop servicing cards issued by Russian banks. In Russia, the cards will continue to work without restrictions, including business cards. Russia is switching to its own payment system Mir.
Cards issued by foreign banks will no longer work in Russia: they will not be allowed to pay for purchases in stores and make transfers to cards of Russian banks.

Visa breaks 7+ years trendlineVisa looks bearish here as it breaches an important trendline.
140$ as next stop?

V - Visa - bearish short countTook a look at Visa this morning with it being in the news and all that and saw this as a possible count. As always with wave theory, there are myriad other possibilities but I quite like this one. I suppose the other viable counts might be that the July high was a 5th wave completion (very bearish) or that it was completion of wave 1 in an ending diagonal of a larger 5th wave. Interesting times indeed.

$V with a Bullish outlook following its earnings #Stocks The PEAD projected a Bullish outlook for $V after a Positive under reaction following its earnings release placing the stock in drift A with an expected accuracy of 80%.

Visa running out of credit. VDownard zigzag.
Immediate targets 214, 204, 197. Invalidation at 291.
We are not in the business of getting every prediction right, no one ever does and that is not the aim of the game. The Fibonacci targets are highlighted in purple with invalidation in red. Fibonacci goals, it is prudent to suggest, are nothing more than mere fractally evident and therefore statistically likely levels that the market will go to. Having said that, the market will always do what it wants and always has a mind of its own. Therefore, none of this is financial advice, so do your own research and rely only on your own analysis. Trading is a true one man sport. Good luck out there and stay safe

Visa Inc| The Next Target For Visas Next Year Will Be $ 280Visa Inc| The Next Target For Visas Next Year Will Be $ 280
Visa Inc. is an American multinational financial services corporation headquartered in Foster City, California, United States.
Visa does not issue cards, extend credit, or set rates and fees for consumers; rather, Visa provides financial institutions with Visa-branded payment products that they then use to offer credit, debit, prepaid, and cash access programs to their customers.
It was launched in September 1958 by Bank of America (BofA) as the BankAmericard credit card program.
Visa is the world's second-largest card payment organization (debit and credit cards combined), after being surpassed by China UnionPay in 2015
The actual market cap of Visa is in the value of $468 B
Technical Analysis:
The price is moving with a very large weekly pattern that it is taking the shape of an "Ascending Channel.
The price is close to the support line and after a small correction, we can see the beginning of the next bullish wave.
From the chart, we can see that the price moves in very stable waves. So once the movement begins it doesn't stop.
Thank you and Good Luck!

Buy Visa 195 to 210 TP 2 month periodBuy now and sell put with strike 195 to get premia 2,8% until 17.12.21

Strong Sell Signal On Visa With High Probability!Hello ladies and gentlemen, according to my graphical analysis of Visa Stock, there is a high probability of a decline towards the 202$ level in the next few weeks!

Buy Visa (V) at 214$-217$ to target 227$-230$Buy Visa at market (probably 214$-217$ range) than w8 some days to sell at 227$-230$

VISA Falling Wedge Poses Attractive Entry OpportunityPrice has been stuck in a falling wedge for the past several weeks; it is currently at the lower end of this pattern and we should see support come in to boost price up. Significant appreciation in price could see a break out of the falling wedge in coming days. MACD also indicates an impending uptrend in price. PT#1 is at the resistance of the wedge - around $227 - and if there is a breakout we could see it rise all the way to $236. Place a stop loss around $220 - at the lower end of the wedge - in case support fails to hold.


VISA Long from bull flagDecent bull flag out of sharp momentum up. MACD Indicates swing point. Initial target is 1R.

A possible Long opportunity Hey traders,
Just spotted an opportunity to go long on Visa stock if the neckline is crossed.

Visa Strong BuyVisa shows a slight oscillation after a high rise to a dip. There you will see a clear indicator of a short rise I believe there will be a three-pronged graph increase. This is a smart time to invest in Visa and will be a great investment.

VSAVSA is get up to make the gap full and the target now to make another gap full in down price , i think for surly the price should get down for that gap.
