VISA same buy setups like MASTERCARDHi everyone:
V has similar price action like MA in my other analysis.
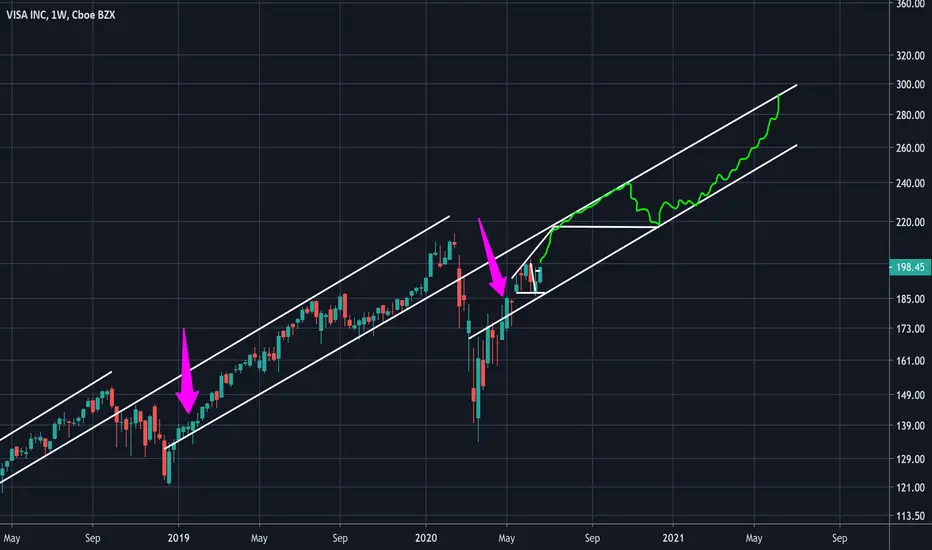
We see the same bull impulse up and price now forming continuation correction.
I am expecting price to correctively go down once more to complete this correction before the strong bull momentum comes in.
Alternatively, price can break above now and forming continuations to keep going up.
When price break above this current correction impulsively, then we can expect price to continue up and hit the previous tops.
Traders, if you like my analysis, please like, follow, and comment. I welcome all kinds of feedback, suggestions and opinions, thank you.
V trade ideas

VISA INCVisa Stocks (V) – the price is staying in the important resistance level around 1.85. That’s why we have to wait till the price forms a breakout and a pullback. In that case you can go long till the target at 2 USD/Share.

Visa Earnings Play - Bullish Setup.Visa looking good with a bullish flag forming as well as a clean retracement bounce off of the .618.

VISA Targets ahead of Earnings - Long !Just a little kinda update to my previous post on Visa. Took the opportunity to load a further 120 shares of VIsa today. Loaded at 189-190 Region on a support retest.
Looking at the target of about 214-219 ahead of earnings that are coming out.
Exciting for the company! Let's see how they perform!
This is not financial advice, please do consider your own DD and RM.

BUY VISA !Long trade setup on ViSA.
Thanks for viewing! This is not financial advice please do your own DD and RM.

In The Portfolio ! I Advais you to keep it in the portfolio , It will rais in the comming days
You Can double Your investment after crosing the bleu line


Positional buy VISA above 200Potential Cup and Handle Pattern breakout , will look for the breakout above 200 above volume. It is a long term stock in my portfolio. Will update the targets once we see the clear breakout


VisaVisa has been a strong bullish market for the past 10 years. Visa went from 15.00 to 210.00. Visa began to fall in the year 2020 dropping down to 135.00.


$VVisa looks interesting.
Above 200 EMA and 50 EMA
Stochastic RSI turning up.
Volume ok,and Volume falling down with price.
All require is brekaout above 200 volume and Green bar.
A 50$ trade possible.


visasqueezya getting diamond top, nasdaq charting bit noisy and have found visa smoother and usually leads the way. Should be all quiet this 4th july. ????


VISA INCNYSE:V
Hey, traders.
We are in the middle of a market correction.
The market's standing in the range.
SPY has the upper level of the channel limited by resistance lines at 313.1, the lower level of the channel is 298.8
If we will break the lower level, we will get a possible fall in the area of 280.
It is hard to say whether the market will be supported or not. I would not bet on buying any time soon.
The market is under pressure from several factors: the virus, Biden's leadership and industry issues for banks and social media companies.
The Dow Jones Industrial Average (-2.8%), Nasdaq Composite (-2.6%) and Russell 2000 (-2.4%) also fell by more than 2.0%.
All 11 sectors of the S&P 500 closed in the negative zone.
The banks were pressured by the Fed's decision to require them to suspend the share buyback and dividend caps in the third quarter.
Also from the negative news is the reluctance of many companies to place their advertising on the FB. Naturally, the company's shares were marked by decline.
This week, we will look at reports on consumer confidence and the number of jobs.
I expect a storm from the volotilities, especially since this working week in the US will be short.
So, in the end, the summary for the beginning of the week: I expect the market to fall. I'm very cautious about longs. I will give priority to short signals.
When trading inside the day, we pay special attention to the SPY behavior.
Now lets see the Visa. This is first candidate to short.
What we see on the chart:
1. A strong mirror level, formed back in December 2019.
2. The resistance level has become a support level.
3. From May 18th to June 9th, we were going up, however we could not consolidate above 200. The strong short player dropped the price to the support level.
4. On the 11th, 12th, 13th and 25th the shorts player tried to break through this level.
5. We are watching a series of retests.
6. The last trading session was closed under the low
7. You can see that the short player has gained position. I expect a break-down level.
I recommend to enter the short strictly according to your trading strategy.


I recommend buying again Will return to rise in the coming days
Technical indicators indicate that Visa INC , will rise in the coming days

Visa, making a charge up $VStrong trend with MACD heading up from zero line. Price above MA's and strong Williams R.

Price near a cluster of MAsPrice near MA 200, MA 100 and MA 50. Fib retracement 61.8 also near. Good to go long at market with initial target @ 200.00
Cancel trade if proce closes below 180.00
Not trading advice, just personal analysis.