VISA - DAILY CHART
Hi, today we are going to talk about Visa and its current landscape.
As nowadays we live in a consumerist society and access to a credit card has continually become easier to obtain, is reasonable to predict that the card debts are also going to rise too, as financial education isn't the strong point of U.S consumers, and are used to the debt culture.
The heat up U.S economy put credit card companies in a more comfortable zone as the unemployment rate remains near to historic lows, which helps customers to keep up with their bills. However, the question that worth to be raised here is, if the 90 days past due card debt is probably surging to 2.01%, the highest level since 2010 amid a heated economy, what is going to happen with this type of debt, once the U.S economy make its first downward movement of correction and make harder for customers pay their credit card bills. Even with the credit card issuers tighten their credit standards, we can't be sure it's going to be enough to avoid a crisis on the sector, which could lead to a flood of bad debt, decline of new credit card issuance and other types of liabilities. This scenario could mean concerning news for Visa if the company doesn't progressively start to deploy the proper countermeasures for this scenario.
Thank you for reading and leave your comments if you like.
To have access to our exclusive contents, join the Traders Heaven today! Link Below.
Disclaimer: All content of Golden Dragon has only educational and informational purposes, and never should be used or take it as financial advice.
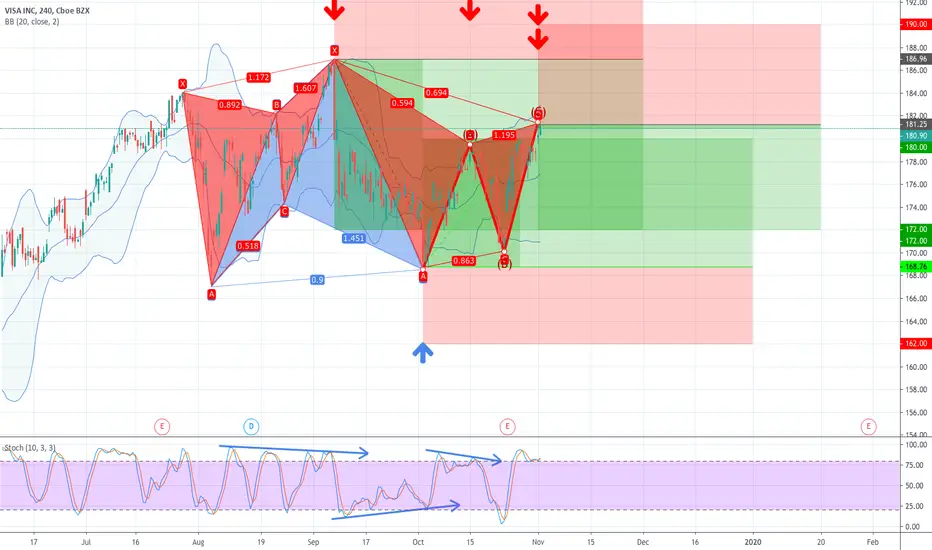
V trade ideas

V (VISA) LONG TIS THE SEASON AND MOREVISA has strong buy signals, green candles AND READ TODAY'S STORY IN YAHOO FINANCE
Visa Inc. V has partnered with MFS Africa, the pan-African fintech leader, to close the gap between the rapidly growing mobile money ecosystem in Africa and the world of online digital payments.
The agreement will significantly expand Visa’s reach and its ability to facilitate commerce in the region.
Earnings - January 30, 2020


Visa is strongVisa can match the strength or better than overall market, and continues to grow. For that reason I am bullish on Visa long.


V reversed from resistance, potential drop!
V reversed off its resistance at 182.64 where it could potentially drop further to 175.18.
Trading CFDs on margin carries high risk.
Losses can exceed the initial investment so please ensure you fully
understand the risks.


V reversed from resistance, potential drop!
V reversed off its resistance at 182.64 where it could potentially drop further to 175.18.
Trading CFDs on margin carries high risk.
Losses can exceed the initial investment so please ensure you fully
understand the risks.


[Long Idea] VV is a big component of the XLK Technology ETF. XLK is already at all time highs, leading the S&P index higher.
The technology sector generally is a safe haven from inflation, which we might be getting soon.
If the market continues to refuse to pullback, we could see a parabolic blow off top, XLK could lead and V could have a lot of upside left.

Visa potential reversal!
Visa expected to rise up to 1st resistance at 181.09 where it could potentially react off and drop down to 1st support at 176.53.
Trading CFDs on margin carries high risk.
Losses can exceed the initial investment so please ensure you fully
understand the risks.


Visa potential reversal!
Visa expected to rise up to 1st resistance at 181.09 where it could potentially react off and drop down to 1st support at 176.53.
Trading CFDs on margin carries high risk.
Losses can exceed the initial investment so please ensure you fully
understand the risks.

V reversed from resistance, potential drop!
V reversed off its resistance at 181.09 where it could potentially drop further to 180.65.
Trading CFDs on margin carries high risk.
Losses can exceed the initial investment so please ensure you fully
understand the risks.

38.2% & POSSIBLE 61.8% Retracement SHORT GWAVE38.2% & POSSIBLE 61.8% Retracement SHORT GWAVE.
FIB Retracement Percentage is calculated in a Higher Cartesian and or Euclidean Dimension.
PLEASE ALWAYS WAIT FOR STOCHASTIC CONFIRMATION!!! THANKS
'Tenkan declining Visa Cards!'We had three consecutive weeks were the market tried but failed to penetrate the weekly Tenkan on close. The story here is the bulls just dnt have what it takes to break this barrier. The market likes paths of less resistance so the upward failure can only mean one thing....the bears are going to come in. The 1st target would be the weekly Kijun and then after that we have an area close to the low of the month. My stop loss is slightly above the three candle wicks...if we get get there and close above the Tenkan that means invalidation. Otherwise looking very red for Visa.
Entry: Two small positions @ 177.85
SL: 181.14
TP1: 172.04
TP2: 169.05

Visa reversed from resistance, potential drop!
Visa reversed off its resistance at 179.89 where it could potentially drop further to 170.48.
Trading CFDs on margin carries high risk.
Losses can exceed the initial investment so please ensure you fully
understand the risks.


$V VISA benefits from adoption to Cashless society Entry level $178.50 = Target price $191 = Stop loss $174.50
Earnings breakdown
Non-GAAP per-share earnings of $1.47 on revenue of $6.13. For comparison, Wall Street was looking for earnings per share and revenue of $1.43 and $6.08 billion.
Non-GAAP EPS comes in 21% higher YoY compared to $1.21.
The Visa earnings report also has revenue increasing by 13% from the $5.43 billion reported during the same time last year.
Operating income of $3.74 billion is 9.68% higher than $3.41 billion reported in fiscal Q4 2018.
The company’s net income of $3.03 billion is 6.32% better compared to $2.85 billion in the same period of the year prior.
V also notes that payments volume was up 9% from the fiscal fourth quarter of 2018.
Technically the chart is in a strong long term uptrend.
Indicators are in a bullish reversal pattern, advances in the stock will be highly dependent on market strength continuing.
P/E ratio 35, quite high but acceptable in such a growth sector.
Average analysts price target $202 & Buy rating.


Visa potential reversal!
Visa expected to rise up to 1st resistance at 179.89 where it could potentially react off and drop down to 1st support at 171.72.
Trading CFDs on margin carries high risk.
Losses can exceed the initial investment so please ensure you fully
understand the risks.


VISA potential reversal!
VISA expected to rise up to 1st resistance at 179.89 where it could potentially react off and drop down to 1st support at 171.72.
Trading CFDs on margin carries high risk.
Losses can exceed the initial investment so please ensure you fully
understand the risks.
