VISAvisa is at resistance the top of the channel this stock moves very consistently in a channel. right now that channel is up
V trade ideas

Visa bearishI am Bearish on Visa. the underlying asset performed well, and now I think it is time to be back somewhere in the 230s to be bullish again. However, there still an unfilled gap and it could be that it

VISA Potential for Bearish Trend Initiation🔹 Last week, VISA experienced a decisive break below a long-standing ascending channel, marked by an unambiguous weekly and daily close. This occurrence constitutes a potential bearish signal, which may swiftly herald the commencement of a substantial downtrend.
🔹In scrutinizing Fibonacci retracement levels, it is notable that a definitive rebound materialized at the 61.8% retracement mark, only to be succeeded by a consequential downward breakout. Moreover, attention must be directed to the 361.8% Fibonacci level, which serves as a prospective ultimate downside target. This is underpinned by the prospect of creating an advantageous risk-to-reward trading setup.
🔹This situation offers a lucrative selling opportunity, and our detailed trade setup has been disseminated within our channel.

$V Head and shouldersVisa closed below its 200sma for the first time this year. Looks to have painted a beautiful head and shoulders pattern, however this has not been confirmed yet (no close below the neck line). It does look as though momentum is shifting towards sellers with the lower highs and with bearish convergence on the oscillators.

Where Will Visa Go Next YearWeekly Chart of Visa.
Visa has had a very long and steep run from 2008 to 2021.
The Corrective Wave looks like a 3-3-5 regular flat correction, where the B wave retraced more than 90 percent of A wave. Currently, C wave is forming. Wave 1 of C wave has formed and wave 2 of C will retrace further, maybe even up to 78.6 percent of wave 1. There is support from trend line.
I expect Visa to go up till end of the year when wave 2 of C wave will complete. Next year, Visa will form waves 3-4-5 of C wave going between 100 to 161.8 retracement of A wave, depending on how strong/weak the market is. There are two support levels at 180 and 140 where C wave may end.

VISA Poised For GreatnessVisa processes more than $11.6 trillion in gross dollar volume (GDV), made up primarily of digital payments with the remainder being things like ATM withdrawals, B2B transactions, etc. Alongside Mastercard, which is en-route to process $9.2 trillion, this makes Visa one of the two largest payment processors in the world. The company evidently has a wide moat that is targeted by competitors and regulators.
While many competitors such as Block (SQ) and Paypal (PYPL) seek to penetrate the high-margin space, Visa is well-positioned to benefit from the continued growth of digital payments and serve as a foundation for digital transactions with a wide moat that can be difficult to substitute.
Digital payments, a core part of Visa’s transaction value, are estimated (2) to reach a $9.5 trillion GDV in 2023, and grow to $12 trillion in 2025.
The Credit Card Competition Act May Be A Major Negative Catalyst
Acknowledging that the passing of this act is not a given, investors may see a large portion of the profits of payment processors like Visa wiped out should this law pass. In its current proposition, the legislation would enable merchants to choose an alternative payment processor (one that isn’t Visa or Mastercard) to execute payments for their customers.
Merchants instead of customers are the ones covering payment processing fees, so they have a large incentive to route payments to the cheapest competitor. Inevitably, Visa will be forced to lower their payment fees to compete with these cheaper alternatives, thereby compromising a key income stream.
Large companies like Walmart and Amazon will especially benefit from this change as they stand to reduce the fees paid to processors like Visa and Mastercard.
I estimate that this bill or a compromised version of it will pass, and erode Visa’s oligopolistic moat, and therefore their margins and net profits.
Visa Will Only Capture 30% of Serviceable Addressable Market
In 2021, the US value of non-cash payments was estimated to be over $128.51 trillion
I estimate a Total Addressable Market (TAM) of $100 trillion to $150 trillion, based off data from the US plus the rest of the world.
But I think that a more realistic Serviceable Addressable Market (SAM - What Visa’s share of the TAM could be) for Visa is between $50 trillion and $75 trillion.
Alternative data estimates indicate that the global SAM for card networks will grow to $60 trillion in 2027. Of the SAM midpoint of $62.5 trillion by 2028, I estimate that Visa manages to capture 30% resulting in a GDV of $18.75 trillion.
Visa had a take rate of about 0.2247% for the last 9 months, up 9.4% YoY from 0.2054%. Assuming Visa captures my estimated GDV of $18.75 trillion, the revenue in 2028 comes up to $42.2 billion (5.8% CAGR revenue growth)
As most of the developed world already prefers cards, Visa will find it more difficult to open up international markets, so I expect the company to reach this high-point.
The International Segment Is A Primary Revenue & Growth Driver
Much of Visa’s growth comes from international markets, and there are two key verticals to watch for the company: e-commerce and B2B cross-border payments which is very pivotal VISA.
E-commerce is growing rapidly, and Visa is the leading payment processor for online transactions, making it well-positioned to capture this growing market.
Visa is also expanding into business-to-business (B2B) payments and cross-border payments. These markets have a lot of potential, and Visa is investing heavily to capitalize on these opportunities.

💵 E a r n i n g s J o u r n a l📶 S T A T I S T I C A L A N A L Y S I S
Current 50-Day Market Trend: short/sellers/negative.
Next Swing: positive to resistance.
Next Wave: buy wave to the ceiling.
Next 50-Day Market Trend: long/buyers/positive.
Trade Type: Touch & Go don't wait for a close.
💵 E A R N I N G S A T A G L A N C E
Release Date: 10/24 AMC
Quarter: FQ4'23
_______________________________________________
Revenue Anticipations: positive surprise of Revenues.
Revenue Surprise-Confidence: on a scale of 0-9, #7
Revenue 2-Year Trend: the company trend in Revenues is positive.
_______________________________________________
EPS Anticipations: positive surprise of EPS.
EPS Surprise-Confidence: on a scale of 0-9, #7
EPS 2-Year Trend: the company trend in EPS is positive.
_______________________________________________
📝 S Y N O P S I S
🟢BUY: If the earnings report is above the Wall Street consensus, I expect the market will buy the +surprise.
⚪NEUTRAL: If the earnings report is released with complicating press, I expect the market will avoid the surprise and invest in alternative securities.
🔴SELL: If the earnings report is below the Wall Street consensus, I expect the market will sell the -surprise.
🔎 R E S E A R C H D E P T H
Technical Analysis: daily chart.
Fundamental Analysis: EPS & Revenue data.
Press/News: none.
Social Media: none.

V Visa Options Ahead of Earnings If you haven`t sold V Visa ahead of the previous earnings:
Then analyzing the options chain and the chart patterns of V Visa prior to the earnings report this week,
I would consider purchasing the 230usd strike price Puts with
an expiration date of 22023-11-17,
for a premium of approximately $5.15.
If these options prove to be profitable prior to the earnings release, I would sell at least half of them.
Looking forward to read your opinion about it.

V | VISA | Informative NYSE:V
Bullish Target Price 1: $241.81 appears as an immediate resistance point, given the horizontal line drawn around that level.
Bullish Target Price 2: If the stock manages to exceed the first target, the next potential bullish target is $244.73.
If the stock price falls below the bearish line located at $238.33:
Bearish Target Price 1: $237.67 seems to be the next support, based on the line illustrated.
Bearish Target Price 2: If the price continues its downward trajectory, it might find support around the $236.21 level.

VISA Marching to the All Time High. Early to buy still.Visa is rising gradually after finding Support firmly on the MA200 (1d) and the bottom of the Channel Up.
In accordance to the previous Channel Up rises, when the MA50 (1d) closes a candle over it, the rally will be confirmed.
Trading Plan:
1. Buy on the current market price.
Targets:
1. 252.90 (All Time High).
Tips:
1. The RSI (1d) rebounded from below the oversold zone (30.00) which justifies buying now and not waiting for the MA50 (1d).
Please like, follow and comment!!


VISA INC, Scraping At The Top, DOUBLE-TOP Pending!Hello There!
Welcome to my new analysis about VISA INC STOCK on the 4-day timeframe perspective. In the recent times the stock market is developing highly differently with stocks that show either bullish or bearish inclinements. In such times it is necessary to pick stocks that have bullish potentials as long-candidates and stocks that have bearish potentials as short-candidates when following a total-return-approach in the market. Total return means to make profits in every market situation either if the market goes up or down and with such a total-return-approach it is the best approach to consider the possibilites and collect a basket of short-candidates and long-candidates. VISA INC STOCK is such a potential short-candidate that can be added to the total-return-basket.
Considering the recent price-action movements VISA INC STOCK is about to scrape on it´s all-time-high region with a weak uptrend that inhabits several lower- to higher amplitude pullbacks and such a weak uptrend is likely to reverse into the other direction when the time is ripe and further indications point to a final reversal. This means when VISA INC STOCK enters the area above the 245 level from there on the possibility for a pullback increases massively and when this pullback emerges with the price-action pulling below the 230 level again the continuation possibility will mark to the high-ends of the possibilty-distribution. This means once the price-action broke below the 50-MA marked in red in my chart the continuation will follow up.
There are several levels and scenarios to watch out once the price-action pulled back from the actual top because with the price-action continuing to pullback below the 50-MA and further on below the main decade-trendline, these will be the validations of the final confirmation of this huge double top as it is seen in my chart. Once the final confirmation of the double-top happened as it is marked the price-action will approach the minimum-double-top-target-zones and in this manner it will be determining on how strong the bearish momentum will continue to move towards these levels because a strong bearish momentum will likely determine a further bearish continuation. For now we will watch out how the stock develops and especially how the confirmations show up to move on with further considerations.
Thank you everybody for watching. It will be great when you support my idea and we move on forward together.
"There are many roads to prosperity, but one must be taken."
VP

V (Visa) Entry, Volume, Target, StopEntry: with price above 245.37
Volume: with volume greater than 4.33M
Target: 256.92 area (this is an area, no guarantee it reaches this price, but you should be selling on the way up)
Stop: Depending on your risk tolerance; Based on an entry of 245.38, 241.38 gets you 3/1 Reward to Risk Ratio.
This LONG swing trade idea is not trade advice and is strictly based on my ideas and technical analysis. No due diligence or fundamental analysis was performed while evaluating this trade idea. Do not take this trade based on my idea, do not follow anyone blindly, do your own analysis and due diligence. I am not a professional trader.

VISA: See the excellent levels this strategy offers.Visa has been trading inside a Channel Up pattern but lately with the 1D technicals neutral (RSI = 50.905, MACD = 0.560, ADX = 28.391). This is despite staying on high levels, finding support on the 1D MA50.
As long as this and the Inside HL trendline hold, we are bullish, aiming at the Inside HH (TP = 251.00). If the price crosses below however, it is very likely to see a 1D MA200 test. Don't buy though before the 1D RSI enters the 0.236 - 0.0 Fibonacci Zone, which has been the strongest buy signal when the last two HL levels of the Channel Up formed. As previously, we will again aim at the Inside HH (TP = 252.00).
## If you like our free content follow our profile to get more daily ideas. ##
## Comments and likes are greatly appreciated. ##

Visa has formed a large level double topVisa has formed a large level double top
This figure shows the weekly candle chart of Visa's stock from the end of 2019 to the present. The graph overlays the bottom to top golden section at the beginning of 2020. As shown in the figure, the combination of last week's high point and 2021 high point of Visa's stock has formed a large level double top shape, both of which are suppressed by the 2.618 position of the gold split at the bottom of the figure! This week, the stock of Visa has fallen back to the bottom of the chart, which is 2.382 on the Golden Divide. In the future, this position will serve as the watershed for judging its strength!

VISA IncWait for Breakout
Stoploss and target given in chart
FUNADAMENTALS
With a Price/Earnings ratio of 28.84, this script can be considered expensive at the moment.
The rest of the industry has a similar Price/Earnings ratio.The Price/Forward Earnings ratio is 23.99, which indicates a rather expensive current valuation.
its Profit Margin of 51.02% is amongst the best of the industry. it outperforms 93.62% of its industry peers.
Total Revenue
$ 7.275 B
Gross Profit
$ 7.275 B
Operating Income
$ 4.865 B

short on V(VISA) towards lower trendline or .618If price breaks downwards after rejecting from the highest high then this trade is live . I woud wait for it to break structure and short on the rejection from the neckline to a profit target of the trendline, (.618) or volume profile. Just a for fun idea , lets see what happens

Visa - Long term ascending patternPretty good risk to reward ratio IMO. NEO:VISA has been forming this long term ascending pattern and looks good to keep going. This is a long term boring trade that will most likely take months to grind higher.
The real question is whether or not we get a pull back to the moving averages. If the market continues up from here I would expect this to do the same.
Cheers

Visa Card At Flip Support Good to buy Visa Card At Flip Support Good to buy
Price action
Good to buy and hold for good profits

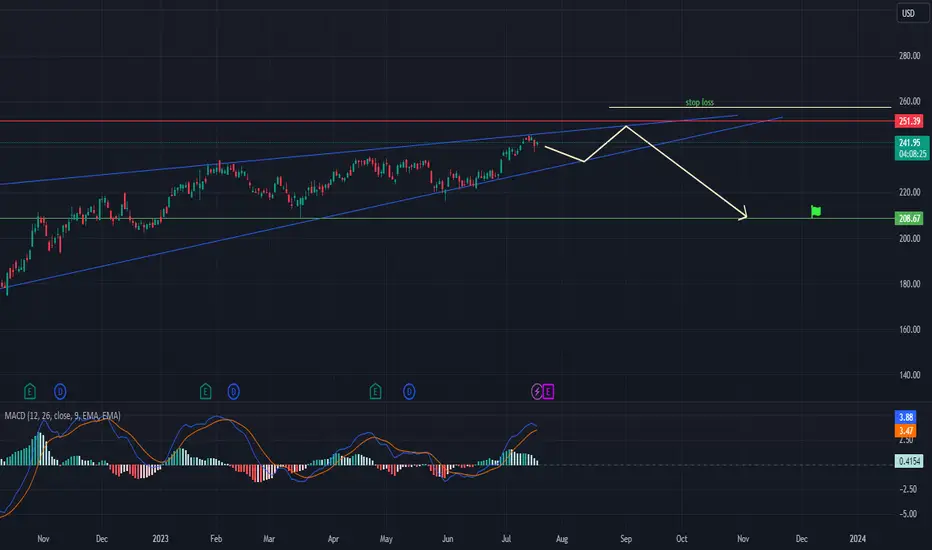
VISA - rising wedge patternVISA has been in an uptrend since October 2022.
The price created the rising wedge pattern which is a bearish formation.
The positive momentum on MACD is decreasing.
Enter a short position at the successful breakdown of the formation.
Stop loss and target for shorts are shown on the chart.
Good luck
The goal of reducing 160$According to the Butterfly pattern and the Fibo, the decline to the target of $ 160 ideally converges. We should reach it by spring, there will be a great point for going to long.


V put credit spreadmacro: snp500 QQQ uptrend, earnings beat
News: unemloyment lower than expected
TA : ema bounce
entry: bullish Price action
STOP: rolling till worthless options
TP: holding until expire
risk: market downturn after very strong first half, fed continue rise interest rate
