XLE trade ideas

$XLE good to LONG XLE is in line with Crude (refer to my previous post.
Price is now siting above MA200 and EMA9 and just touched MA20 on Aug 24 before retrace down a bit.
Keep an eye on this one

Bullish island reversal with positive momentum divergenceThe SPDR Select energy sector ETF (XLE) is gapping up to kick off the week and creating a 2-bar bullish island reversal at prior support and with bullish momentum divergence. This could be exactly what the bulls needed to kick this prior leader back into gear.
No position personally, but looks good for at least short-term continuation.

Short term: XLE back to resistancePossible H/S pattern setting up in XLE. Don't know if it all plays out but I think XLE pushes back to right shoulders top.


Bearish top formation on XLE Energy stocksIt looks like some form of topping pattern in $XLE - 46.25 key level to trigger.
Focus on 50.57 and 52.50 as resistance levels to keep a bearish bias.


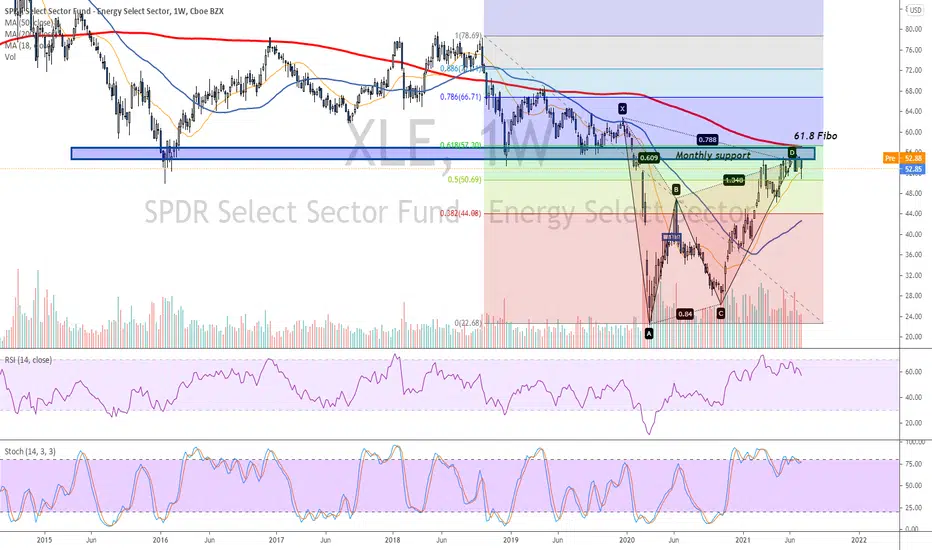
Energy Stocks Are Hugely Oversold, By This MeasureEnergy is the top performing sector this year, despite two months of weakness. It now appears hugely oversold in comparison with crude oil prices.
The chart below shows the ratio of the SPDR Energy ETF against crude oil CFDs. Notice how the current ratio is among the lowest of all time.
The next chart shows USOIL with daily candles. It had a quick dive under $66 and the 50-day simple moving average (SMA) early last week, but immediately recovered. That now looks like a false breakdown. Its 8-day exponential moving average (EMA) has also just crossed above the 21-day EMA.
Returning to our main chart of XLE, notice how prices bounced around $46.50. This was the low in April, and the blow-off peak back in June 2020 when the market initially rebounded from the pandemic. Now that this level has been tested and held, the bulls may target the next major obstacle: the historical long-term resistance at $56 that we cited in mid-June.
TradeStation is a pioneer in the trading industry, providing access to stocks, options, futures and cryptocurrencies. See our Overview for more.


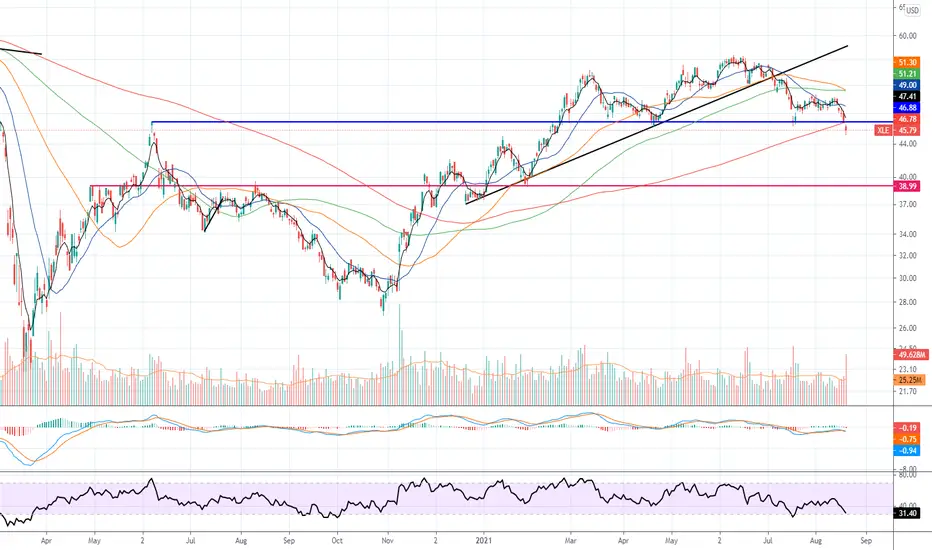
XLE Head and Shoulders Top?AMEX:XLE has formed a head and shoulders top. It broke the neckline on July 7 and today it failed again after retesting the neckline.
Looks like a good shorting opportunity.

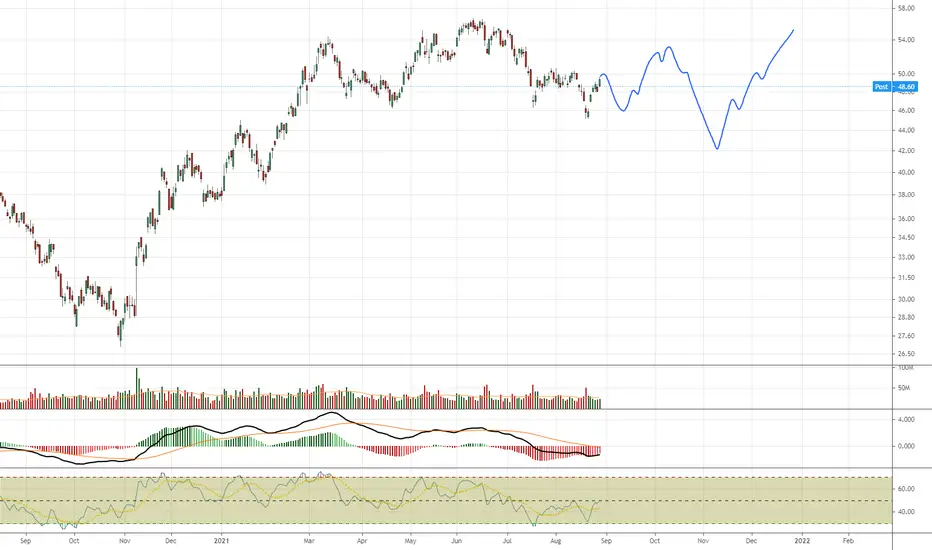
XLE SP500 Energy Sector SPDRWhen doing my sector research, I noticed that the stochastic levels were decreasing. I like levels under 50% and this is currently at 24% today. The put to call ratio is under 1 sitting at 0.92 post-market which indicates that there are a tad bit more puts that were closed today versus yesterday which indicates that more calls are slowly entering the market. The energy market is due for a spike in my opinion as the economy is slowly recovering and demand is slowly increasing with talks of the infrastructure bill along increased oil demand as of late. The only thing worries me is the lack of unemployment growth and job acceptance compared to job growth which has been increasing.
As far as the chart itself, on the Daily timeframe I noticed that the RSI is in the "oversold" territory and the MACD just crossed over to the green territory which indicates a possible reversal soon to come. I've also noticed that "Support #1" has potentially been broken. I want to make sure my 4HR and 1HR time frames match to the daily regarding the RSI and MACD which it is pretty close in my opinion. Since "Support #1" has been broken, I went to the 4HR and 1HR to confirm in which I saw the Support #1 being broke through with strong bearish candles. This indicates that price could potentially begin testing "Support #2". I used the fibonnaci indicator to trace a potential retracement from and to the resistance and the support levels to create the discount price area and the target price area.
Before entering I want to see bullish candles in the discount zone on the 1HR timeframe!
I hope this give you some form of sentiment.
Thanks for the support!

XLE shortXLE has reached the top trend, filled gaps from the previous crash and now under the 200wma. Looks like it could start to sell off here.

XLE Energy poised for another leg higherGoing through weekend charts and noticed a lot of energy names popping up on the scans so I pulled up XLE. I marked up this chart awhile ago as price was coming into the 55 area where I expected some resistance. Price pulled back in the 55 zone and retested the downward trend line. If price can work its way above the red box a push higher is likely. First target area would be 65 then 72. Energy names to watch would include XEC & EOG.

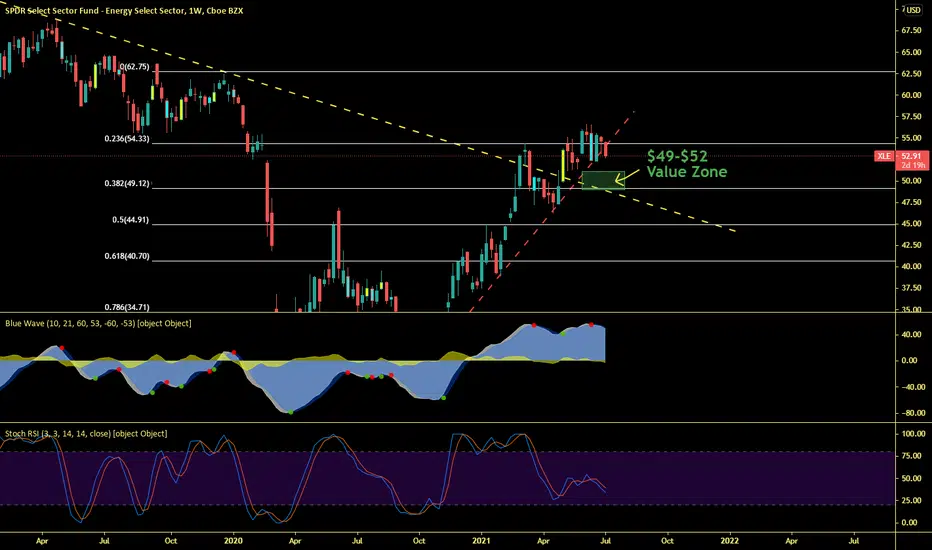
XLE can go a little lowerGoing long on XLE in the listed value zone is a better play than shorting Energy stocks at the moment.
XLE is gonna go trough the roof, by August. ER by the period as well.
this is the longterm "trend" (line) to follow. Would imagine getting above it to be super bullish. Once XLE/SPY gets "above", where it needs to be, more volume would hop in opportunistically.


Biden's energy performance puts past presidents to shameHmm ... so the Democrats, apparently, want to kill energy??? Maybe it's good for their shareholders!
