XLE trade ideas


Trade Update: Sell 25-50% and move stop to breakeven Ingenuity Trading Model- Swing Trading Algorithm used in all markets- Stocks, Forex, Futures, and Crypto
The model is a Geometric Markov Model :
In probability theory, a Markov model is a stochastic model used to predict randomly changing systems. Markov Models are used in all aspects of life from Google search to daily weather forecast. The randomly changing systems we focus on are the equity, futures, and forex markets. The geometric element of the model is the fractal wave structure you can find on any chart you look at across any market and across all time dimensions.
Our model focuses on the current wave formation (current state)- geometric price formation along with its volume and volatility over a given time period and using that information to predict the future state- future price movement. For more information visit our website

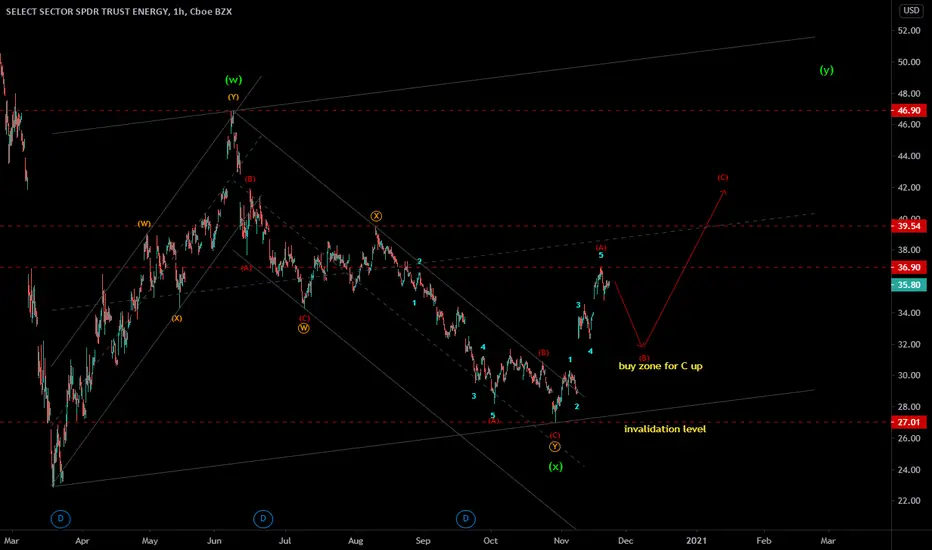
XLE - Elliottwave analysis - ABC correction - dump and pumpXLE - It is within complex correction WXY and Y up seems in progress. The up move from last bottom was impulse cycle as wave A and correcting down in wave B. It can be sell set up with invalidation level above 36.90 with relatively small size. for abc of B wave down. Once B wave is over, it is good buy point for next up cycle as C wave.
Give thumbs up if you really like the trade idea.
Rotation hedge with Energy ETFOk boyz, so you guys are strong believer in momentum, you've ran your backtests on US Sectors and fund out that with a roughly 55% probability the best performers of last year will be the best performers of the next year. So you are still long tech like crazy and believe the FAANG stocks will keep rising. However what does financial professionals like to do? They hedge part of their risk, they maximize their sharp ratio by minimizing volatility with diversification in uncorrelated assets.
What is your biggest risk right now? With a new vaccine on the way? => A big rotation of smart money from leaders (tech, healthcare) to laggards (Energy, Financials, Transportation, REITS). It's already happening right now.
XLE US is down 45% year to date, it is the ultimate laggard ! And you know what? Historical probability of worst laggard to move to the top five leaders of next year is 65%, odds are in our favor.
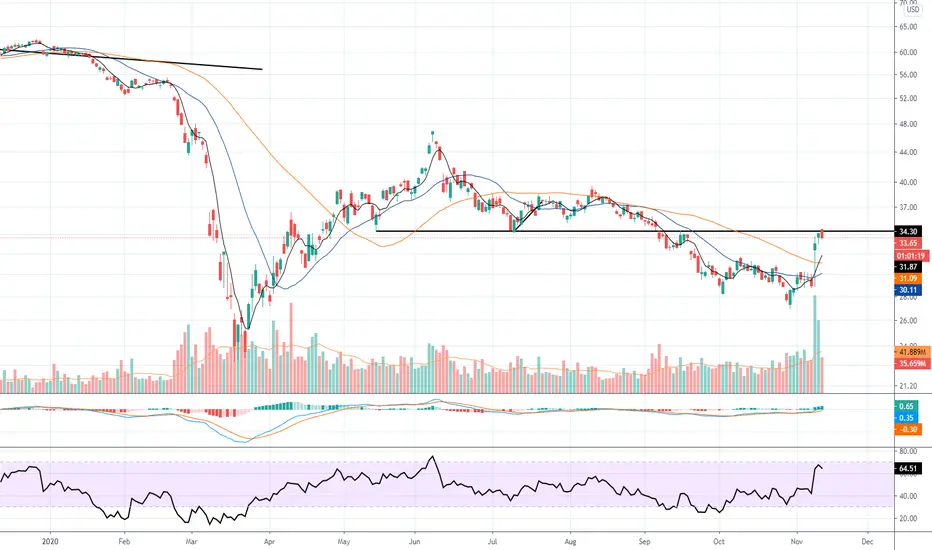
The ETF showed strong momentum last week with a nice weekly hammer candlestick with strong volume, this is a bullish reversion pattern. Let's wait for confirmation on Monday's open, if it confirms, we are catching the first wave to a nice ride up ! up to recovery and post covid world. The vaccine wont be massively available and massively distributed before mid 2021 I believe, HOWEVER the stock market is merely the second order of the real economy, not the first order! It is the acceleration of the economy, so as soon as the vaccine is being shoot the first person, the widespread reopening will increase tremendously.
Option 101 => acceleration = second order = GAMMA, we want to be long gamma right now => buy calls 3 months on XLE. To save some carry cost, i would suggest a strike at 110% of the current spot, this translate to a roughly 35% Delta. This is quite out of the money but i believe the volatility on this sector is going to up with the spot.
my pick : call 31Mar2021 strike 37. Delta = 24%,
Remember: this strategy makes sense if your portfolio is globally long tech, and please do not risk more than 5% of your portfolio value with the premium. This is not WSB :D


energy double bottom potentially spottedEnergy as measured in XLE could be creating a base and or accumulation support.
Energy is one of the worst performing sectors this years. there is still serious risk while oil prices remain pressured lower and could still get worse for energy if we see further decline.
disclosure: I am long using long term deep in the money options 9-12 months out.


Soon, Make This Cyclical Bet That Everyone Else Is Afraid ToWhile the recent pain in fossil fuel companies and overall bullish run in clean energy names seems to have given the impression that oil is finally in its inevitable secular downtrend, I prefer to look at the situation and see a massive cyclical medium term buying opportunity. While its obvious that over time oil and gas companies will *eventually* see their demise as our entire energy infrastructure pivots to renewables, right now we are probably at least a decade away from transitioning even 50% of it. This fear, combined with a potential democratic presidency, combined with a massive demand shock in the form of COVID 19, and traditional energy giants are struggling, trading at record low valuations.
While I believe in the general maxim that the market does a good job at discounting the future, and that lots of oil companies deserve to be trading where they are trading, I also believe that sometimes the market slingshots prices too far in one direction or the other, and our entire job as traders rests on the ability to correctly identify these discrepancies and take advantage of them. Quality energy assets, not distressed ones, will make it through the current hurdles just fine, and will likely see much, much higher prices from here as our grid / transportation infrastructure still absolutely require their presence. In the space I like BP and ENB the most.
Combined with this has been a massive run in the prices of solar and renewable generation capacity, like CSIQ, BEP, and NEE. I view this as run as an identification of Solar's secular trend and upside, but also as a bet on a friendly democratic administration coming to power next week. If Trump wins, this premium instantly gets wiped out. If Biden wins, I view it largely as a 'sell the news' scenario. Either way, I think solar has come too far too fast, and is both 1.) set to retrace some gains and 2.) far away from fully supplanting our national energy infrastructure.
Thus, my cyclical bet. I think that sometime soon, traditional energy names will begin to massively outperform clean energy names as this realization sets in, and on the chart above I'm waiting to see some bullishness in the price action before I dip a toe. If the trend confirms on the monthly chart then I'll be scaling in with full size. Use this idea how you will, but keep it on your radar!!
Cheers!


XLE ENERGY SECTOR PIVOT
Calling bottom here...golden zone. generational low... lets see if I am right. I bought ERX at $8.90.

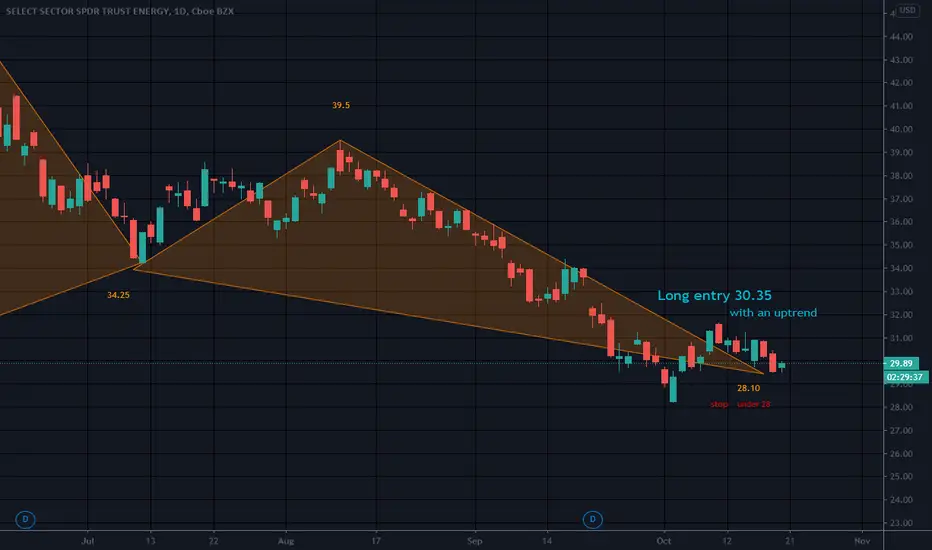
Bullish Bat Bottom Fishing Falling WedgeCan oil go much lower?
Upper trendline of FW is at 30.70
Long at entry level with an UPTREND
Possible T2/Long term/ 58.6 to 67
op 10 Holdings
XOM - Exxon Mobil Corp22.86%
CVX - Chevron Corp22.77%
COP - ConocoPhillips4.77%
KMI - Kinder Morgan Inc Class P4.58%
WMB - Williams Companies Inc4.55%
PSX - Phillips 664.32%
SLB - Schlumberger Ltd4.12%
EOG - EOG Resources Inc3.99%
MPC - Marathon Petroleum Corp3.64%
VLO - Valero Energy Corp3.37%
Not a recommendation


Oil and Energy Markets finding a Perfect Storm?It wasn't market makers who named the latest U.S. Hurricane "Delta," but they probably would have suggested the same name if anyone asked them. With the storm about to hit the gulf shores in the U.S. causing lockdowns in oil and gas facilities in the region, supplies of oil and natural gas are both constrained. This comes right at time when demand is increasing in the U.S. economy, and buyers are returning to the market. It could be a perfect storm for the Energy sector AMEX:XLE in U.S. stocks, and for commodity currencies such as the Aussie FX:AUDUSD , Loonie FX:USDCAD , and Pound FX:GBPUSD .

XLE break to the upside. Target 31.50Plotting the XLE index with 4 hour candles, we observe a clear downward tendency since mid August. However, the 20 MA suggests a bottom at around 29.75, with the price closing above the MA for the last 8 candles (roughly 4 days). If the price can close above 31.50 tomorrow, we are bullish towards 32.50 as our first objetive.
