Market Outlook & Trading StrategiesAn in-depth comparison in relative strength of various US sectors from peak to trough, complementary to previous post.
It appears that investors have repositioned in recent recovery with a "lockdown" theme, weighting heavier in their investments with healthcare ($XLV), fundamentally strong tech ($XLK) (e.g. $AMZN) and consumer staples ($XLP) (e.g. $WMT).
We are still in favour of stock picking/sector ETFs which should outperform buying into the index.
XLE trade ideas

Nice bounce off the .23 FIBThinking weve got a chance to fill a gap here. Gotta bust through $35 to make it happen. Could take a week or so.
Bought $55 Calls For $0.04 today on a 9/30 exp. Seems like an easy move. Low risk fairly high reward

Oil has tested it's $20 support 3 times in the last monthYou can try to short oil but there is much more upside by going long.
I picked up 122 $55 XLE calls today for .03 each
Not a whole lot to lose and a whole lot to gain. Oil isn't going away like some people think. Way too many industries are reliant upon it and way too many people will lose money if it stays at these prices.
It might not be very soon but there is room for it to rise in the next 6 months.


Should return to the middle channel by August.Collect dividends while you wait for a return to the mid channel which I am predicting to be in August.

XLE (Energy Sector)Providing we don’t make any lower lows on the weekly time frame and preferably stay above resistance, last seen in August 2004, this could potentially be the place to buy and hold for the medium to long term.
The next level to watch out for to the upside comes in at 37.71, stronger resistance at 41.47 closing the gap. Above that 48.11 then 38.2 fib level at 52.94.

XLE to long, from 28 to 33Existing Condition:
1. Downtrend line was broken by breakaway Gap (G1). Start a new trend.
2. Gap Up above SMA50
3. double bottom reversal pattern confirmed Weekly demand zone in 11/28/2003;
4. 0.5 retracement,
5. Demand Zone,
6. price droped below 27.1, and back to above 27.8 (above SMA8)
Entry above (SMA8) 27.7 and below 28.5
Stop below (SMA8) 27.5
Target 33.5
Risk/reward=1:6
According to my yesterday' XLE analysis, I created this plan;
This is a trading school homework. I need 6 months to practice trading plan.
If you like it, thank you for your support. Please use SIM/Demo account to try it, until my trading plans get high winning rate.

XLE XLE made a low of $22.89 on March 18, 2020, which is the lowest it has been since 2002. We saw higher highs and higher lows while trading below some previous support around the $26.90-$27.00 has tested the $26.80 numerous times and failed to break the previous support range. The recent gap up and test of the $26.80s again has proven that the XLE has some legs in the short term while respecting and bouncing off intraday lows. A break-through of the previous support ($26.90-$27.00) will prove to be vital to the strength of XLE moving forward. Given the economic conditions, oil is poised for some rebound given demand and the recent activities within the space, and a breakthrough has potential based on the chart.

XLE IS THE PLACE FOR MEBuy cheap. Sell expensive. Buy fear. Sell/short greed. I don't have an established trend here but I like energy long term. Now let's hope that ETF's don't collapse.

XLE-STRONG SELL-Fib SpiralXLE is a strong sell!
Will update.
Option Trade will be posted soon at fibmarketwatch.com
-AB

Energy Sector - Waiting for Divergence Over 60% of energy stocks below their 52 week lows.
Exteme pessimism, think we're setting up for a reversal but still need to be patient.
----------------------------------
Not financial advice etc.

long term energy This is a long term call on energy. The sector is nearing extreme oversold levels that previously led to long term bullish runs.

XLE - weekly charts - mild consolidation before further failureLet us again look out on how XLE is shaping up
(previous analysis attached for your reference)
Price moving just as expected, as evident in the charts, we had support on $ 53.36 levels , which was 24th Dec 2019 low. Price closed at about this level over the last few weeks but during the week, this level was breached. Minor cycle low formed 27th Jan 2020, 2 weeks later than we expected. As we move ahead, the next minor cycle and the major cycle will be moving upwards and the intermediate cycle will start to curve downwards. Following Hurst's principle of summation, we could expect the price to try and move higher over the next weeks. So far price has been making lower highs and much lower lows, indicating downtrend. Expect a failure on any attempt tp move upwards and intermediate cycle bottom around end of March 2020. Larger trouble remains ahead near Aug 2020 end as we would be seeing a bottom of all 3 cycles together. Keep an eye on how these charts develop to maximize opportunities of gain.
If you like what you see, share a thumbs up and follow for more updates
Cheers

XLE - Short - pain continuationHi everyone, today I am reviewing. the energy index XLE on the weekly time frame.
XLE seems to be following a 44 week cycle. XLE made a triple top formation from beginning of 2018 till about 2018 November ever since then it has got into a declining phase, consistently making lower highs and even lower lows. Price has recently breached the previous lows made in the end of Dec 2019, its probably confirmed my projections for a sustained downtrend.
We can see that the downward trend line that we have drawn is now acting as a resistance of a barrier for price to breach. We can see the nuances of principles of summation as descibed by the legendary JM Hursts works in play. This we can be by price action, given the phases in which each of the short term, intermediate and long term cycle (indicated by green, orange and yellow colours).
I maintain my short position on this ETF any upside a chance to go short. Look out for important resistance zones on daily charts to find an entry to go short.
If you like what you see, please share thumbs up.

$spy Looks like consolidation pattern for downward continuationfor energy. Lets see how it shakes out.
"XLE: expect a confirmation before going up" by ThinkingAntsOk4H Chart Explanation:
- Price is on an important Weekly Support Zone. Price may bounce from here.
- To confirm the up move, wait for price to break the Descending Trendline.
- After that, we expect a Bullish Corrective Structure to trade it towards the Resistance Zone.
Weekly Vision:
Daily Vision:
Updates coming soon!

Reversal$XLE looks to be reversing here on good volume, most energy names look good for a move back up


SPDR Energy ETF: Long-Term Breakdown in Market's Weakest Sector?We've earlier cited downside in S&P Oil & Gas Exploration Fund and Halliburton . Now we're taking a step back to look at the bigger picture on the SPDR Energy ETF . It isn't pretty for the bulls.
As many traders know, XLE is the market's worst-performing major sector by a wide margin. A global crude-oil glut and mediocre economic growth are hurting crude prices. Throw on top of that heavy debt loads at many companies and weak quarterly results ( Exxon Mobil and Chevron today). You also have coronavirus reducing air travel.
Finally, the trend toward ESG investing is already giving money managers less reason to hold traditional fossil-fuel companies.
This backdrop has been taking shape on XLE's long-term chart. The fund had a violent drop in 2014 and 2015, followed by 3-4 years of consolidation. The S&P 500 broke out to new major highs twice during that period (late 2016 and late 2019), but neither time did XLE follow. That's a classic sign of weak price action.
While XLE's weekly chart was neutral between 2015 and 2018, it's turned more bearish since last April by forming a series of lower highs. That's now become a descending triangle, with the potential for the earlier downward move to continue.
That could result in accelerating downside with volatility rising. Options traders may want to consider favoring longer-term vega trades. Situations like this can favor buying longer-dated out-of-the money puts.
XLE's chart at this point may have some support at the 2016 low of $50. However, when you consider the long-term nature of the breakdown apparently happening, a retest of the 2009 lows under $40 isn't out of the question.


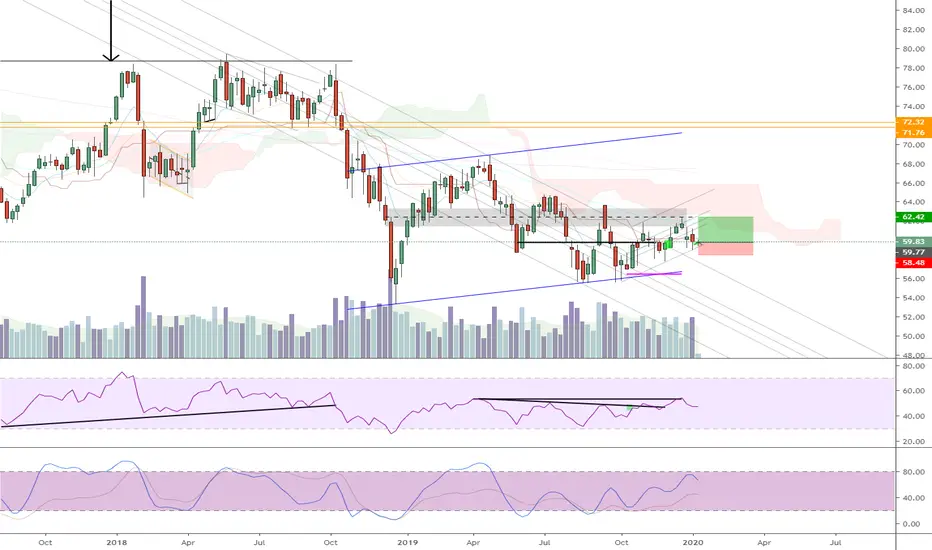
XLE Ascending Triangle to be formed While the horizontal line continues to be drawn along the swing highs, and a rising trendline to be drawn along the swing lows, XLE is forming the ascending triangle pattern as a bullish information. The target could be taken at the horizontal line which also considered a resistance and a stop loss could typically be placed just outside the pattern on the lower band which is at roughly 58-59 levels.
On the fundamental side, here comes the news as Supply threats push oil prices higher.
Crude futures surged as much as 1.7% overnight amid threats to supply, but have now pared some gains, up 0.5% to $58.86/bbl.
Forces loyal to Libyan commander Khalifa Haftar blocked exports at ports under his control, causing the National Oil Corp. to declare force majeure, which can allow Libya to legally suspend delivery contracts.
Iraq also temporarily stopped work on an oil field on Sunday and supply from a second production site is at risk amid widespread protests.
Besides , during 1/2 through 1/13 sessions, there were some bullish bets detected on the options chain that total valued around 1.32 million long calls strike from 61.21 to 65.21 expiring in Feb, March and Jun.

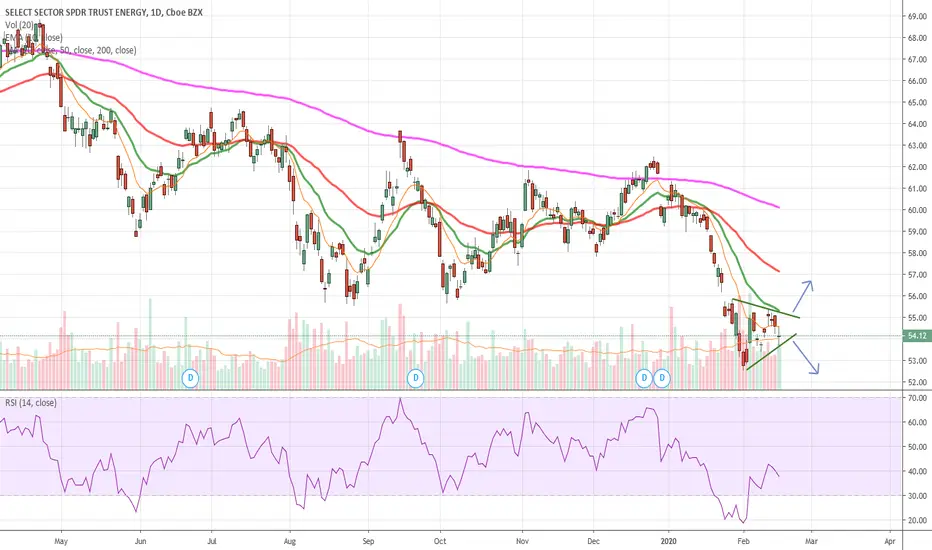
2:1 RR Energy - Weekly Idea13/Jan/2020 08:19 PM AUTHOR: Brandon Gum
--
Part of me says not the best place to put your cash right now when software and tech are so hot.
Another part of me see's that if oil can stabilize here you might get a relief bounce and price recovery in both Oil and XLE.
======================