XLE trade ideas

XLE - A look at absolute and relative performanceCharted above is the performance of XLE on both a relative and absolute basis. Looking a both offers some additional perspective on the health of the sector vs. focusing solely on the underlying price of the index.
On a relative basis, this sector broke down from a long term trend before it became fully apparent in the price. XLE had well defined support going back to 2006. It was the break of this support that really got the price moving lower. It looks like for now the sector has found support on a relative basis at a level that goes back to 2005/2006.
Looking forward, if the broader market continues to move higher its possible the sector will stabilize around these price levels while continuing to move lower on a relative basis. However, any market weakness and XLE could underperform even more significantly. The next area of interest for the sector is marked by the shaded box above. The sector traded in this range for nearly 4 years from 2000 to 2004. This area is also the projected price target for breakdown in the descending wedge marked above.
Individual plays and short term bounces may present themselves but from a mid to long term perspective, I don't see an attractive risk-reward for this sector at this time. Something worth keeping a watch on for sure though.

XLE, bullish divergence?1 month ago, i warned that if price failed to regain above ~88.70 it might mean a potential wave 5. And indeed it happened with a gap down passing by the bear flag and previous support of 82.05.
My short entry triggered at 88.06 and i exited fully at 75.45.
Once that little black gap is filled, i humbly tell myself that the OPEC created wave 5 is completed, plus the bullish divergence in MACD & RSI.
Two days before the black gap, there is a BULLISH ENGULFING candlestick pattern on 28th & 31st Dec 2012 with massive volume. And this ~71.34 level also have 2 confluence supporting lines extended previously.
Any price between 70-75 is a good average buy for me :-)
Projection/Speculation for the next few months is formation of inverted H&S to fill that wave 4-5 GAP
Apologize for complicating lines

XLE Energy Sector (Daily). Potential Recovery Rally.XLE Energy Sector (Daily)
Potential Recovery Rally.
Bullish reversal 15/10/2014. Heavy volume turn.
Uptrend, with higher lows.
Broke downtrend_line.
Clearing 50 sma resistance.
Broadening reverse Triangle.
RSI bullish.
Oil potential rebound. ( attached )

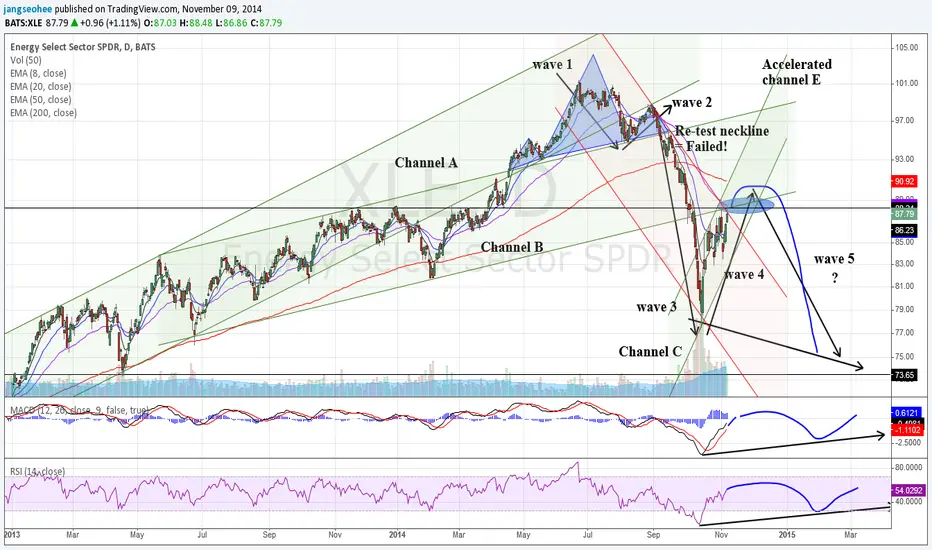
Wave 5 brewing for XLE?Channel B is a typical health uptrend. But things get out of control and went euphoric producing a Head & Shoulder at extended Channel A. Price fell back to Channel B and launched another break out but failed due to double resistance of neckline which is also Channel B resistance.
Subsequently, it was a one sided affair from the bears hitting price straight below channel B and culminated momentarily at downtrend channel bottom.
Using the simplest EW wave analysis i understand, i am seeing the maturing of wave 4. As highlighted in the blue resistance region, which arises from confluence of downtrend channel top + Channel B bottom + horizontal resistance. If there is a break out and price go higher, 200ema will be a good rejection point. If blue resistance is very strong, once price started to head lower.. i would consider wave 4 completed.
Essentially i am anticipating a final wave 5 to be in play which could be leveled around 77 or lower, by then we would have a lower low in price and higher low in both indicator to give a stronger signal to long.
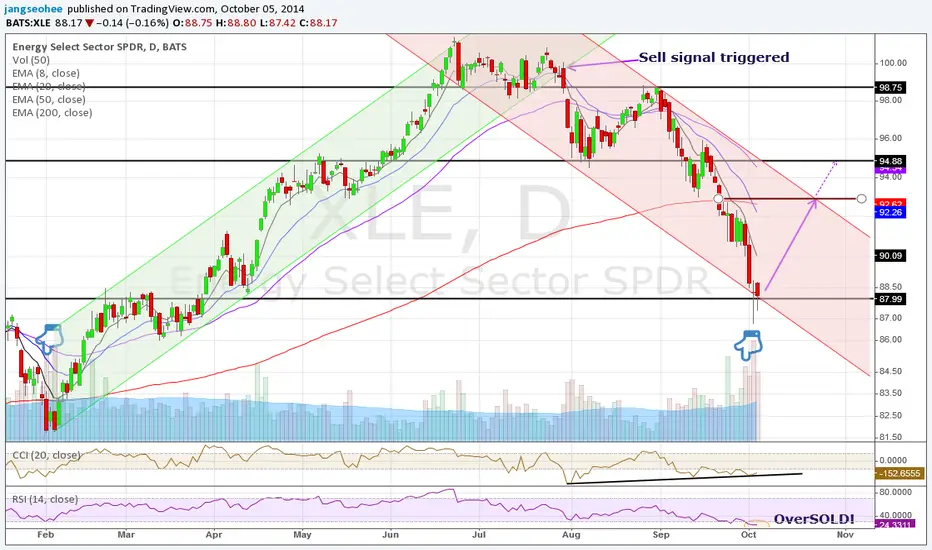
Energy sector looks badPrice make a solid broke out since late March, and ultimately form a H&S top which ultimately broke down to previous R/S line. Now price is going to re-test ~88.70 again, further rejection would mean freefall for energy sector.
Even if price broke out 88.70 again, 200ema is another resistance level.


Energy Select Sector SPDR (ETF) (NYSEARCA:XLE) Is LeadingToday the markets are seeing some ugly declines and to the average investor, there seems to be no bottom in sight. Everyone is looking at Ebola as the culprit for spooking the markets. While this might be true, I am looking at Energy Select Sector SPDR (ETF) (NYSEARCA:XLE) as the reason this market has seen a dramatic fall recently. I wrote an article a couple months ago as seen here, discussing how the Energy Select Sector SPDR (ETF) (NYSEARCA:XLE) had diverged from the overall market and was talking to us. While this market might have some more downside to it, I am looking at the weekly chart of Energy Select Sector SPDR (ETF) (NYSEARCA:XLE), as you can see, we are into a very good support area here around $77.25. In my opinion, it is the XLE chart that will dictate the market direction, not Ebola.
If you are looking for market guidance and direction, make sure it comes from the Elite Round Table.Our FREE market emails contain information that can actually make you money for both short term trading and long term investing.
Parm Mann
Elite Round Table
Follow me on twitter: @ParmMannTrader


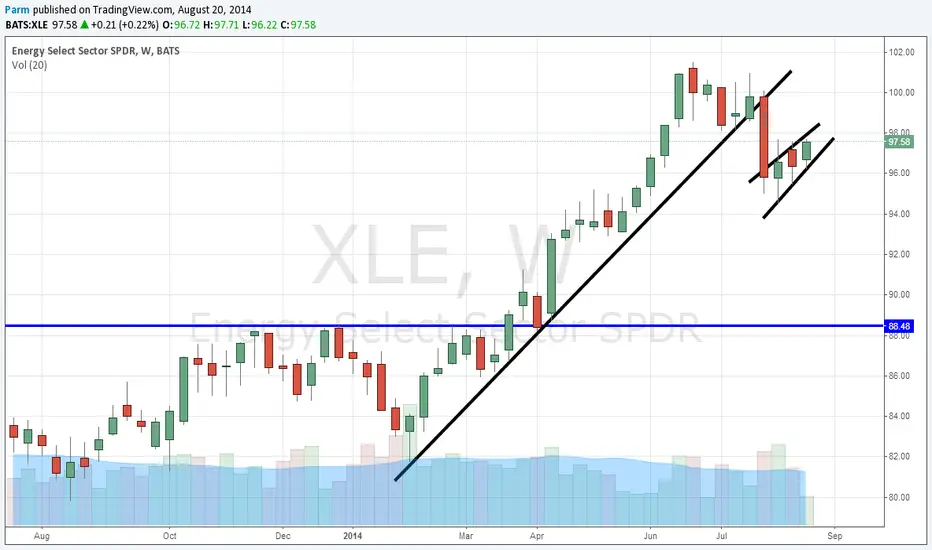
Energy Sector, Temporary Bottom?In feb, when DJIA triggered a massive long signal, this energy XLE sector was brought along for half a year.
However, when the price hit the top, there wasn't any MACD & RSI divergence signals at all.
End of July saw the break of short-term uptrend line twice, which trigger a sell signal.
Subsequently the price has engaged in the downtrend channel nicely.
On friday's close, it was another bearish candle with the fact that crude oil futures drop below $90 and close at 89.71.
But i am doing a little big of contrarian long again here due to:
1. the downtrend channel seems to be well respected upper and lower
2. RSI has no bullish divergence level, but it is way way OVERSOLD!
3. Bullish divergence happen in CCI, although CCI gives randomly reliable signal
4. two rejection below 88
5. the volume for last three trading day looks like climatic selling (while Funds are climatic buying?) and this volume is comparable to the temporary bottom back in Feb.
1st target will be around 92 which coincide with the resistance of downtrend channel and slight around 200ema. Anything more bullish can see it test 94.88 again.
XLE - looking to buyPullback
Status: Building position
Technicals:
Horizontal S&R: yes, weekly and daily
Channel S&R: some. raising red trend line looks good at $90
MA S&R: yes
Pearson's R >= 85: ok
Price within Fib Ret..62: yes
Stochastic turn/crossover above 80%: daily good. weekly still little early
AO pullback >0<1.38: daily no, weekly ok


XLE is energy stocks turning around?XLE energy sector is underperforming the market in the last 3 months
a look in the long term chart reveals a steady uptrend starting in mid 2012
then in feb 2014 price become more assertive and didn't have a "real" correction
fib retracement show support at 94$ and price action today may suggest that the correction is at its end
crossing the dashed black line will be confirmation to resume uptrend
1st resistance at 98.5$
if price crosses resistance raise stop instead of taking profit at 130.6
as long as the channel is intact price will go higher

PAIRS TRADE: Short XLE, Go Long Crude OilWidest spread in 5 years in XLE versus Crude Oil (Cl1!-front month)-
Use this wide spread to leg into positions and set your sights on a big reversion in this wide spread.
Tim
9/2/2014 2:40PM EST

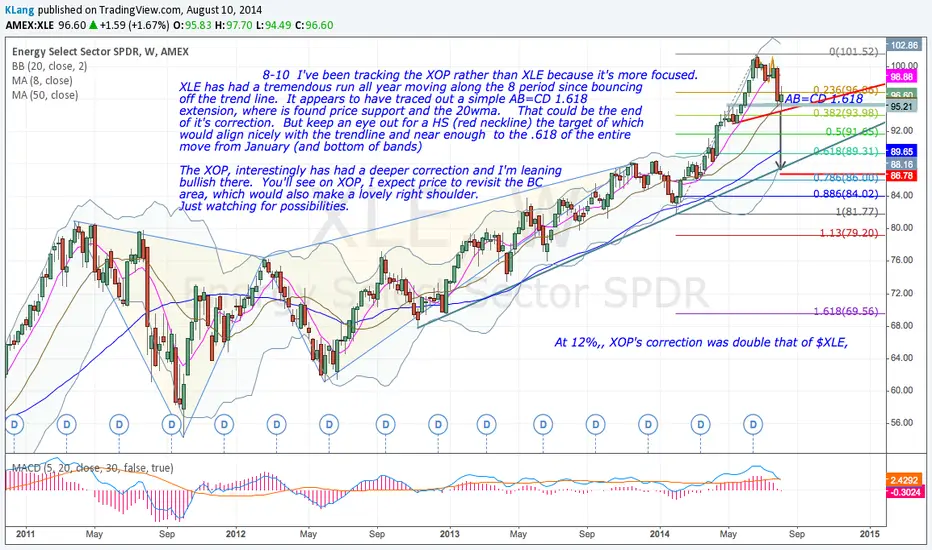
Market Rally Is Lacking Energy Select Sector SPDR (ETF) (NYSEARCThe S&P 500 made a low of 1904.78 on August 7, and has basically gone straight up since that day. If you look at the chart, it has formed a perfect "V" and is looking to challenge its all time high of 1991.39. The Nasdaq has definitely lead the charge higher, crossing the 4500 mark for the first time in 14 years! While the markets have moved higher, I notice that the energy sector (as represented by the Energy Select Sector SPDR (ETF) (NYSEARCA:XLE) has not participated in this rise.
The Energy Select Sector SPDR (ETF) (NYSEARCA:XLE) is a very key sector and was one of the market leaders when the S&P 500 was making new all time highs on a daily basis. The reason for the under performance by this group has primarily been due in large part to the declining price of crude oil, which has fallen by 12% since mid June. This under performance could be foretelling of something that smart investors are not looking at right now.
So is this energy weakness a buying opportunity?
I have included a chart below showing the weekly chart for the Energy Select Sector SPDR (ETF) (NYSEARCA:XLE). As you can see, it is nowhere near its high watermark of $101.52, which was set back on June 23. Does this mean that the sector will play catch up to the broader indexes? Well with summer winding down and the end of the "driving season" fast approaching, I would suspect further downside could be in the tank. The chart is telling us all this, as it is currently forming a bearish pattern. While these markets have had this impressive rally off the lows, this chart clearly shows it could be lacking the needed "energy" to keep it going.
Come trade with us as we provide calls like these from the past month and more. Get our live trades exactly when we enter and exit the markets for profit... step inside the Elite Round Table now and don't look back!
Parm Mann
Elite Round Table
Follow me on twitter: @ParmMannTrader
Join the Elite Round Table on Facebook
Oil investors bewarehello all,
while scanning the broader market I recently stumbled upon the energy sector's ETF (XLE) and the message I got was startling to say the least. Energy itself has been on quite a run of late but it appears as though that rally may have run out of steam. Indeed, the Double top registered through late July looks rather solid and support levels look a long way away from current levels. For those that missed the original topping even, I could see a nice rally off the 38.2 Fib ('1st stop' target) back up into resistance. The OTE (short) zone at the moment coincides with both the down trend line off the top and some gaps that ought to be filled. If I wasn't short now, I would use that counter trend rally (OTE short sweet spot 99.30) to get short and risk against that double top high (101.52). Targets remain the 50% level (91.65) and ultimately the OTE (long) zone and its sweet spot near 87.00.
Cheers all and hope my simple analysis is of benefit
Brian
aka CRInvestor

Potential Short sell on Energy Select Sector Confluence of CD=1.618 AB, 2.24 BC extension and 1.618 leg of the Deep Crab pattern all converge in a tight area between 95.62 and 101.40.
In addition to this they converge to the logical number 100.00. Hence a pull back, not a reversal, sounds like a tempting trading idea.
Stop Loss order: 103.00
Entry: 97.45
Target Profit : 75.00

XLE outperformer vs overall market Energy and oil stocks act better than broad market. Money rotates in this sector. $WFT $BHI $HAL $XOM and others are on their highs.
Nice flagging near highs in this ETF and it looks poised to make a move higher with well defined stop below $93.

$XLE Head & ShouldersEnergy has been on a breakout for a month now. It might be about to dry up based on MM to 94.84 on H&S bottom. I entered on 89, will be putting tight stop in at 94 if/when it breaks 94. Watching to see if it forms bull flag after that
