XLE Energy ETF, retesting breakout.XLE Energy
XOI Index has broken out relative the S&P 500 from the
beginning of April. Testing the brakeout.
Preferred Rotation Sector with Oil staying elevated.
Pattern-wise the current pullback is corrective, which
in the bigger picture is still very constructive, using any weakness to add.
MACD bullish.
Support : 87
targets: 92, 95
XLE trade ideas

Energy upsideI like both $FLSR and $KED if market stabilizes who have shown recent strength $FLSR $KED

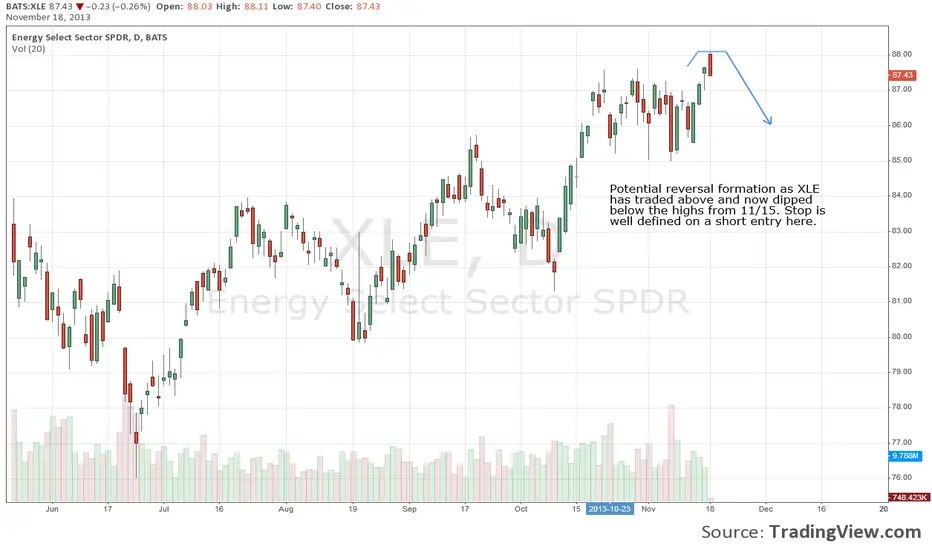
XLE LONGThe energy patch broke out of its
long trading range yesterday and is
now breaking out. I missed this breakout
entry point and will be looking for a pullback
for entry

Update: A Rally, Then A Rolling? | #XLE $SPDR $AMEXFriends,
On February 02nd, we cautioned traders about a potential new historical high to 93.08 using this WEEKLY chart.
Since then, a bullish pinbar sent price to a current weekly high of about 84.75, corresponding to a 2-month old structural resistance of a Shark. For the astute, advanced pattern trader, one should expect the current rally to stall at 50% of the recent downward impulse leg that developed over the past 6 candles from above $88.00 to recent higher-low level.
OVERALL:
At this point, we find no significant technical event that should alter our original predictive analysis and forecasting. Our directional bias remains bullish with a cautious technical mark at 93.08 as a potential overhead reversal, and probable distant bearish targets down below.
A break above 93.08 will prompt us to redefine new overhead targets with greater granularity than we can provide at the moment.
Cheers,
David Alcindor | 4xQuad
Predictive Analysis & Forecasting
Denver, Colorado, USA
--------------------------------------------------
PS: Here is a weekly SPX chart worth considering:
www.tradingview.com
- Other recent analysis and charting:
AAPL - www.tradingview.com
AMD - www.tradingview.com
EBAY - www.tradingview.com
FB - www.tradingview.com
GOOG - www.tradingview.com
MSFT - www.tradingview.com
TWTR - www.tradingview.com
-------------------------------------------------
- Follow us on Twitter: @4xForecaster
- See our live charts on TradingView.com: 4xForecaster
- Our social history is on Facebook: www.4xQuad.com
Recent forecast hits:
1 - #USDollar: on.fb.me
2 - #AUDUSD: on.fb.me
3 - #NGAS: on.fb.me
More archived here: bit.ly
---------------------------------
Disclaimer: All of our analyses are for educational purpose only. The forecasts, analyses and opinions generated herein are not trading recommendations. We trust that you would do your own due diligence first, then seek professional advice from a licensed professional and enter the market at your own perils - David Alcindor - a.k.a.: 4xForecaster | 4xQuad, LLC.

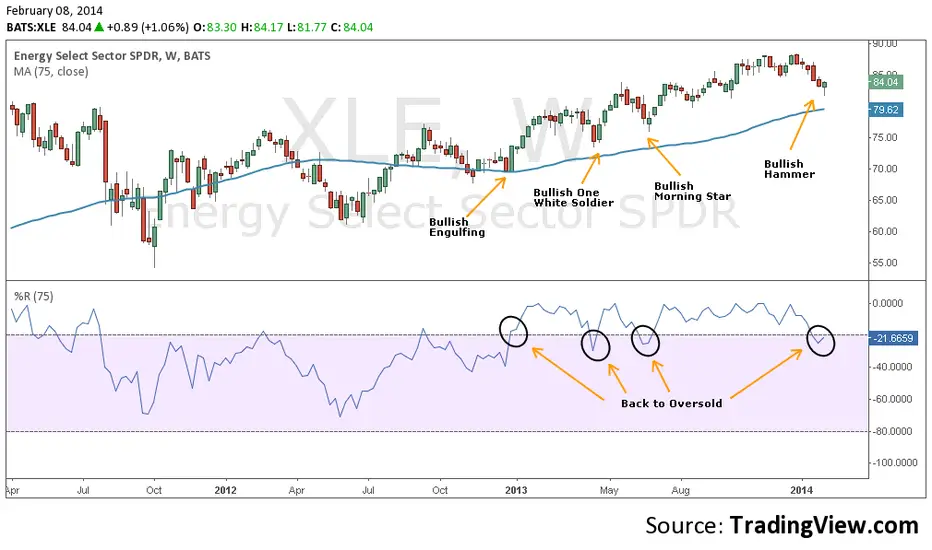
XLE reversal opportunityXLE's streak of five consecutive losing weeks came to an end this week with a .79% gain and an equally important "hammer". The hammer candle in the attached chart is a potential bullish reversal candle that requires confirmation. As a coincident indicator we use the "overbought/oversold" Williams %R indicator. An overbought condition is bullish for the ETF and bullish conditions can remain so for extended periods of time. Prior reversals have coincided with a small dip of the Williams %R below overbought and then a sharp reversal back to overbought. If next week is positive for XLE we can consider this reversal confirmed and higher prices ahead.


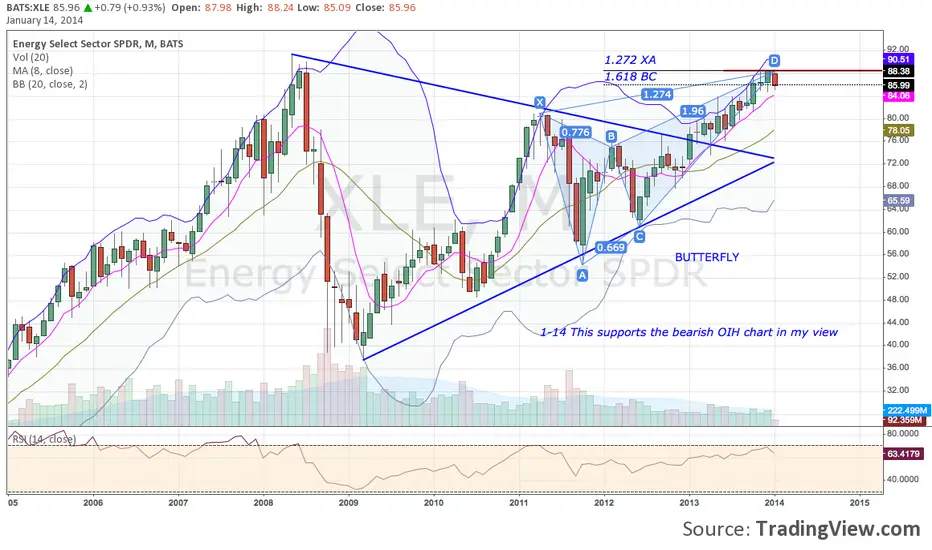
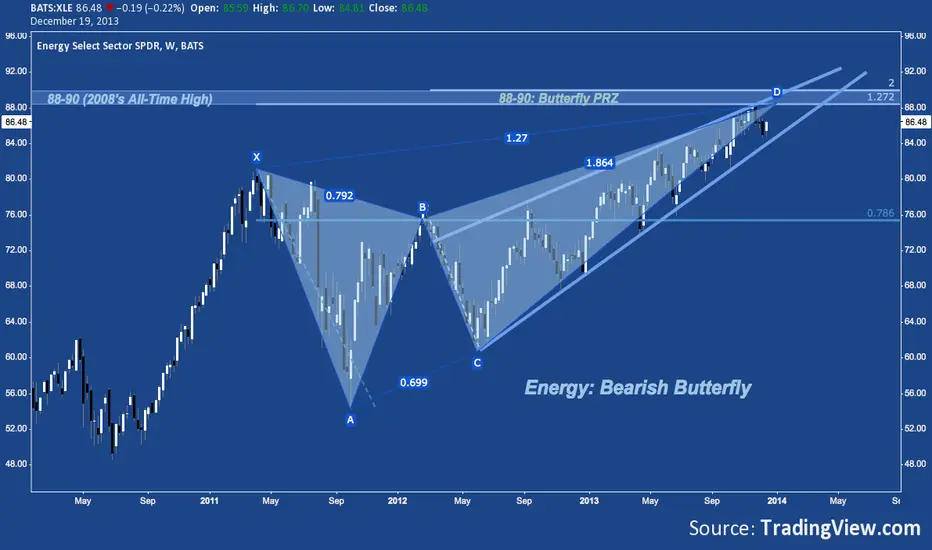
XLE Butterfly Pattern + Rising WedgeWeekly Chart
There is a nice Butterfly Pattern combined with a rising wedge,
price action seems to have a bearish reaction,
Volumes seem to decrease,
Stop-Loss juste above the recent high,
Target @ a strong support,
Have a good trading,
Benaki66


XLE / SPYXLE stocks continue to underperform the SPY. Watch the red line closely. It could be a battle ground, but if it breaks it's very bad for Energy Bulls.

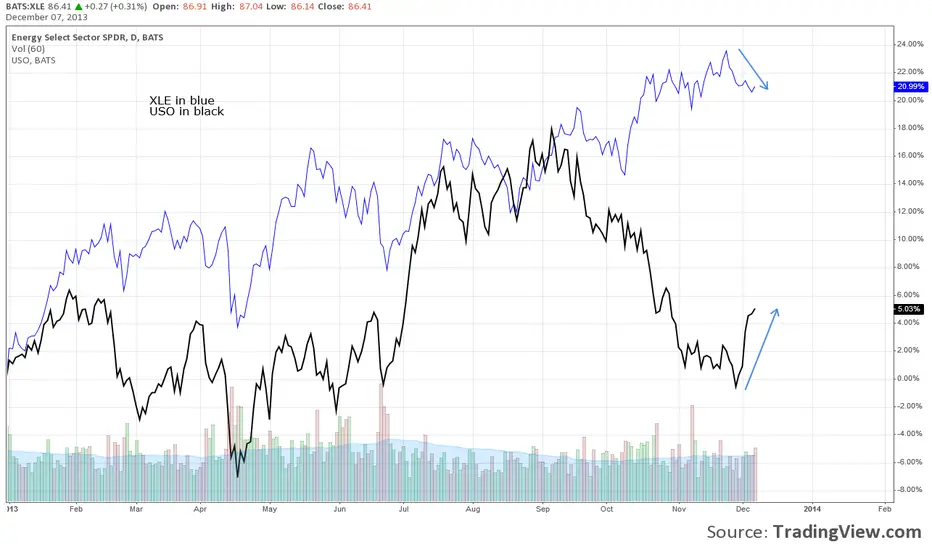
The XLE / USO spread has tightened up in recent days---- $USO <<<<<<< After. Looking for more tightening

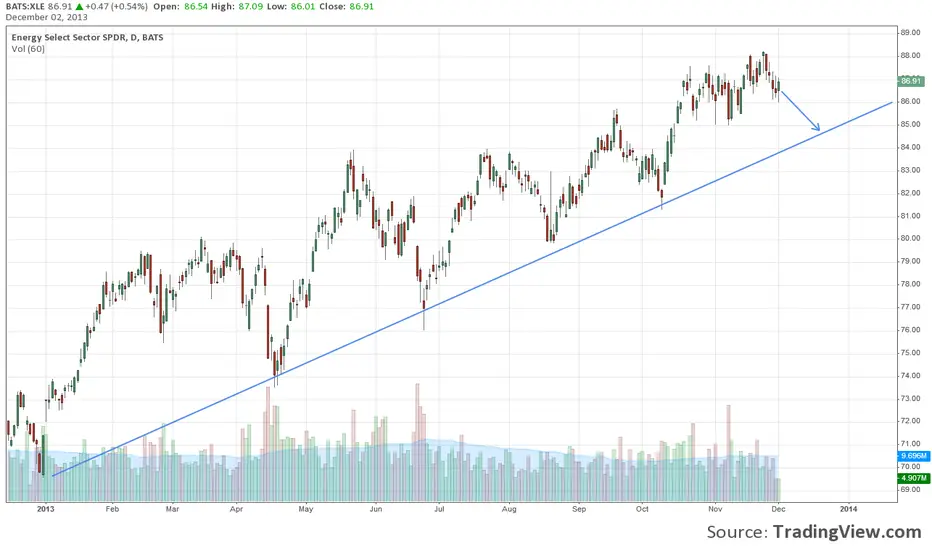
The YTD trend line in XLE has been your guideWon't be surprised to see another test of that trend line. Short XLE