XLE - Minor Low Breakout XLE is in a sideways trend with market and Oil weakness.
Pro's - Darvas support, 200 propulsion, RAF Extreme, Vscore Extreme. L2 target is at 200prop.
Con's - Sideways R/Y trend.
Entry - $85.30
Profit - 50% range - $86.70
25% Stop Loss
21APR23 85 Calls
XLE trade ideas

XLEChart looks 90% identical to the Dow jones .
Both are sitting right on Weekly support of its 50sma .
XLE bounced off its daily 200sma (Gold wave) , I think we will bounce and retest our 50sma (Purple wave)..
Stop loss is a close below 81

Week 6 - 2023 - Weekly S&P500 Sector AnalysisDiscussing all the major weekly trends for each sector.

$XLE vs $SPY: Rotation back into oil stocksI think this is the play right here, right now...Might be a nice swing to the upside for oil names, specially relative to the market.
Best of luck!
Cheers,
Ivan Labrie.

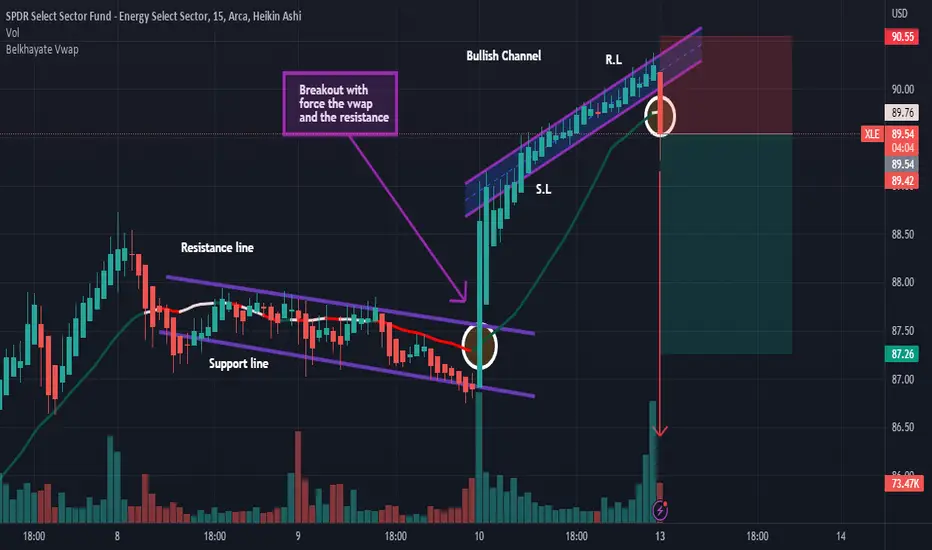
XLE: sell ideaOn XLE we will have a big probability of a downtrend after the breakout with force the support and vwap! Thanks!


XLE - the bigger short It's a controversial call to say energy prices are going to drop dramatically into next year but this is what the XLE chart is showing.
We're at a double top with monthly bearish RSI divergence, and the same structural trendline where it fell last time. My guess is it could get back down to 50. If it's a C leg it could happen faster than most would expect. 50 area would be a confluence of support - channel trendline and horizontal trendline, also IF a C leg comes, 50 is about 1.618 fib extension from the A leg.
This idea is invalid if XLE can hold above 102 on a monthly close. Good luck!

SPDR Select Sector Fund looking great for upside to $120Perfect Cup and Handle has formed with XLE.
We just need to wait for the crucial breakout and close above the brim level.
With moving averages, all is looking great with 7>21>200 - Green - Bullish
RSI - Buy divergence >50 - Bullish
Target 1 $120.00
GENERAL INFO:
The SPDR Select Sector Fund is a series of exchange-traded funds (ETFs) that are managed by State Street Global Advisors.
It is designed to track the performance of specific sectors of the S&P 500 index. There are 22 different funds covering sectors like Energy, Financials, Health Care, and Technology.
This is available as it's a cost-efficient way for investors to gain exposure to specific sectors of the market, without buying individual stocks.
This fund also gives an indication on the sentiment in general markets. Which looking at this analysis it's bullish and we can expect the markets to continue up in February. Fantastic!


Could $XLE be making a bear flag?A break and close below the ascending channel could mean that $XLE could be around $76.4 in the near future.
Some support areas to keep an eye on are $81.9 and $78.9.
One to keep an eye on!

energy in a pickleno really, this thing is set to roar. big rigs, big pigs, young hogs and motor fog. letterr rrrrrrip! were down near the bottom of the envelope, were way oversold, and the sectir is acting defensively in rotation with a bear market. id like to revisit the top of this rectangle and then dump again 🤷

XLE: A ZONE TO WATCH IN THE ENERGY SECTORSince October of 2022 we have seen an interesting zone form in the SPDR Energy Sector ETF. This zone is marked by the yellow rectangle in the chart. We noted four support bounces in this zone, a breakthrough of the zone, and two rejection bounces. This support/resistance zone is one to watch over the coming weeks. A rally into the yellow zone is one to watch closely for a potential rejection.

Energy stocks have topped... For NowFollowing the recent oil selloff the XLE sector is now pulling back. With a clear divergence in the RSI with the 3 recent price tops, it seems like the XLE has completed 5 waves up. Following that is a 3 wave correction as a flat and is now preparing to finish the last leg of it, before exploding higher sometime next year.

Potential XLE Swing Short Double Top clearly closing below resistance w/ Daily Divergences
Simple Support & Resistance trade, S&P looks ready for consolidation
Higher Risk implied as Energy has been DOMINATING .

XLE 1/20/23 90Pthe crude oil droped from 130 to 80. energy sector has cycle, it cant stay on the top for a long time. I bought puts on 11/28, it is developing a possible head shoulder pattern on daily chart. My first target is 85.

There's an old saying Tennessee...AMEX:XLE
Fool me once.... Shame on, Shame on you.
Fool me twice... ummm, uhhhh, you can't get fooled again. - W
Short XLE
Bear Divergence, Divergence against Crude.
XLE Targets:
Target 1 = $59 ~50% Fib Energy Point.
Target 2 = $50.50 ~61.8% Fib Energy Point.
Fat_Fat

Breaking down. Broke down out of recent consolidation. This could end up being a precursor to a double top, too early to say the least.

XLE About to continue higherXLE Energy Sector from S&P500 is still about to continue higher. Still same fundamental preasure.
I do not care about macros,.. just look at that Monhtly Fair Value Gap.. look for long there
Not an financial advice.
DYOR

A divergence between XLE & USOILHey all,
I'm making this post to take note of the clear divergence between XLE (energy stocks) and USOIL (the price of oil ). The movements of these two tickers tend to mirror each other, with good fundamental reason behind why- the price of oil tends to increase the profit margins of energy companies, increasing the profits these companies experience. As it is very obvious, the price movements of the two are now relatively far apart from one another with XLE being far above USOIL . I do not expect this to last, and I expect the divergence to correct itself- as history has always seemed to have done.
I imagine there are only two ways to play this divergence... 1. By betting that USOIL will catch back up to XLE , OR 2. By betting that XLE will drop down to match how low USOIL is. I would only consider playing the SECOND option as I consider myself bearish on the markets at the current stages, and believe that XLE is overdue for a significant correction; as the price of oil has dropped significantly, the profit margins of the energy companies in XLE will have decreased, meaning these companies will see decreased profits in their upcoming quarterly report(s), giving a fundamental reason for why energy companies could fall. Moreover, on smaller time frames, I believe that XLE looks as though it has lost momentum & put in a local peak, and is now going to head lower to match how low USOIL has fallen in contrast. I am open to any discussion and would love to hear different opinions.

XLE Energy sector FAANG of 2022Energy sector perform well in 2022 almost 46.6% till to date. Russian invasion boost it well and Energy and Oil stocks big profits, but these stocks and sector can not trend for long connected with supply and demand. Winter running in Europe and it's almost on peak or little more gap to upside.

$XLE looks like a short- back to $60?I know everyone wants to be bullish energy, and I agree with the thesis over the long term, but the shorter term looks ugly.
XLE looks like it's topped out here and wants to fall back to the $70 range, or below back to $60 (as this region has never been tested as support on the way up).
I'd be a seller here and not a buyer. I do think a drop to $60 or so is a good long term buy.
