XLF -- Possible trade opportunityXLF -- Possible trade opportunity based of price, volume and chart pattern
XLF trade ideas
Weekly review of SPY, QQQ, GC, CL, ETH, BTC, UBER, TOAST, TKOWeekly review of SPY, QQQ, GC, CL, ETH, BTC, UBER, TOAST, TKO

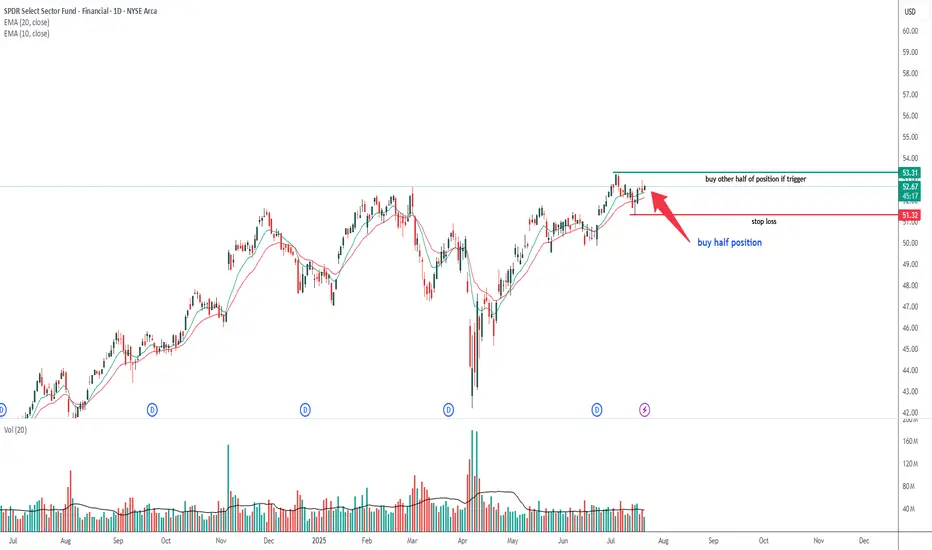
Pre-Earnings Breakout in Financials?Financials could be attempting a breakout, two weeks before the sector kicks off earnings season.
The first pattern on today’s chart of the SPDR Select Sector Financial ETF is the price level around $52. XLF stalled at that zone in February after peaking about 1 percent below it in November. February 28’s final price of $52.18 could be especially important because it represented the highest weekly close.
The fund broke above it on Monday and remaining here could represent a potentially more significant breakout.
Second is the narrow price range between mid-May and late June. (Notice the tightening Bollinger Band Width.) Could that period of price compression open the door to price expansion?
Third, the 8-day exponential moving average (EMA) is above the 21-day EMA. MACD is also rising. Those signals may reflect short-term bullishness.
Next, the steadily rising 200-day simple moving average may reflect long-term bullishness.
Finally, the calendar may be a factor because Wells Fargo reports earnings on Monday, July 14. Citi, JPMorgan Chase, Bank of America and others follow later in the week.
Standardized Performances for the ETF mentioned above:
SPDR Select Sector Financial ETF (XLF)
1-year: +27.39%
5-years: +126.32%
10-year: +164.49%
(As of June 30, 2025)
Exchange Traded Funds ("ETFs") are subject to management fees and other expenses. Before making investment decisions, investors should carefully read information found in the prospectus or summary prospectus, if available, including investment objectives, risks, charges, and expenses. Click here to find the prospectus.
TradeStation has, for decades, advanced the trading industry, providing access to stocks, options and futures. If you're born to trade, we could be for you. See our Overview for more.
Past performance, whether actual or indicated by historical tests of strategies, is no guarantee of future performance or success. There is a possibility that you may sustain a loss equal to or greater than your entire investment regardless of which asset class you trade (equities, options or futures); therefore, you should not invest or risk money that you cannot afford to lose. Online trading is not suitable for all investors. View the document titled Characteristics and Risks of Standardized Options at www.TradeStation.com . Before trading any asset class, customers must read the relevant risk disclosure statements on www.TradeStation.com . System access and trade placement and execution may be delayed or fail due to market volatility and volume, quote delays, system and software errors, Internet traffic, outages and other factors.
Securities and futures trading is offered to self-directed customers by TradeStation Securities, Inc., a broker-dealer registered with the Securities and Exchange Commission and a futures commission merchant licensed with the Commodity Futures Trading Commission). TradeStation Securities is a member of the Financial Industry Regulatory Authority, the National Futures Association, and a number of exchanges.
TradeStation Securities, Inc. and TradeStation Technologies, Inc. are each wholly owned subsidiaries of TradeStation Group, Inc., both operating, and providing products and services, under the TradeStation brand and trademark. When applying for, or purchasing, accounts, subscriptions, products and services, it is important that you know which company you will be dealing with. Visit www.TradeStation.com for further important information explaining what this means.

The Big Banks are in BIG TROUBLEAs you can see on this weekly chart, the XLF has been in this steady up trend since October 2023. It bounced off this upward slopping trendline 3 different times and then finally broke through it on the 4th hit, then came back up to test the underside of the trendline as resistance. It did get back above the trendline briefly last month, but it ended up being a bull trap as it fell back below the trendline and is now testing it as resistance once again and is currently being rejected. A Fibonacci retrace shows the 0.786 fib level also lines up with this area giving added confluence, as well as RSI divergence that I have highlighted. Massive Massive resistance in this area and so much room for potential downside. I see this trade as an extremely high probability of playing out. The options market agrees with me as well.

Weekly review of SPY, QQQ, GC, CL, ETH, BTC, UBER, TOAST, TKO, Weekly review of SPY, QQQ, GC, CL, ETH, BTC, UBER, TOAST, TKO, XLE -- June 6/30/25

Rhythm of the Great BearUndead Bear Captain's Log
April 27, 2025
Will make one final attempt to chart and navigate the murky waters of the Great Bear.
XLF may be a good candidate with still distinct waves, like XRT, XLRE and XHB.
All other sectors, especially SPY are skewed by tech, same-day options and basically unchartable.
I call this map the rhythm of the great bear. It is for my own use, as I like attuning to the waves of the great ocean, the beat of music or the rise and fall of civilizations.
XBI is the nascent child, XLK the moody teen, SPY the resilient adult and DJI the steady grandparent. In markets, I think it is the child that shows the way to growth and decline. XBI shows signs of the Great Bear, having stumbled through an initial decline in 2023 and crawled its way through 2 years of recovery, the so called running flat correction.
This market has thrived through over a decade of MMT, pummeled briefly by covid, only to receive the greatest injection of digital print since all of history. The little people are suffering the effects of inflation everywhere. Wages have barely budged since 20 years ago, yet housing prices have quadupled, automobiles and everything else Mom & Dad can think of have at least doubled. People are literally crumbling toward the lowest rung of Maslow's hierachy, able only to take care of basic needs.
Beneath the streets of folks struggling to survive, we can uncover that the housing market existing home sales is basically at its lowest point since the GFC and banks are still struggling to manage the bond sell-off over the last 5 years.
On top of this decade of MMT mess, the half sane President has declared cold war on basically the entire world. He points the finger of USA's problems at everyone exept USA and magically believes USA can somehow snap factories and skilled workers into existence out of thin air to make America great again without its friends, partners (and slaves). Yet 160 year East-West civilization cycles say otherwise. In fact it points to power eventually returning to the Eastern world.
The sudden viscious market decline followed by Trump backpedalling and market rebound are strong signs of an initial wave 1, wave 2. It can wake up the bear. It can thunder the quake. It can bring on the tsunami where 15-25 such waves can arrive at an unimaginable velocity.
When such waves arrive, what is any man, woman, child to do? Who can ride such waves without a chart? The waters will flip ships, smash hulls, rip entire masts off of galleons.
Yet, with a proper chart, one could ride it like a pirate and secure the ONE PIECE.
Arr, arr, I sail into the storm, full of courage, a wee bit of wit, and an insane amount of folly!!!
Arr, arr, this be the end of the captain's log.

Banking Sector Recovery : XLF IndexI think the markets love Joe Biden. After he won the elections the market just made nice recoveries. On this XLF index I am looking at $32.00 price target before the end of 2020.

XLF watch $48.45/68: Key Resistance holding up the Recovery WaveXLF trying to recover along with the general market.
Currently resting a proven resistance at $48.45-48.68
Bears look to be winning, so look at supports below.

XLF Trade LevelsThe financial sector interests me, especially with an upcoming interest rate meeting, earnings report, and declining consumer sentiment.
Ultimately, I like to swing the Sector ETF's but they also make for affordable day trades!
With XLF being in a tight range on the Weekly+ timeframes, it makes it easy to daytrade within those levels.

XLF Banking crash comingThis is something I have worried for sometime and my main reason for being very bearish. Tariff has only help uncover the banking mess hiding underneath. XLF could crash 5-6% in couple of sessions based on VP
www.theguardian.com

XLF C next Friday JPM,MS,BLK, and WFC followed by AXP the following Thursday will the big sell off ill looking at picking up $45 calls exp 4/18 there's a couple gaps to fill on the way up. will probably buy a small amount allowing me to average in

XLF Head and Shoulders patternEarlier today I commented not to go long today because XLF hasn't completed it's pattern yet. This is the pattern I was talking abut, H&S on the daily chart. So unless congress does something over the weekend to rescind tariffs, XLF will complete this pattern Monday.
I didn't short it because I expect congress to do something, but it's a matter of when. When they do, the bounce will be so huge, it'll wipe out any put option. Not to mention, the pattern should complete Monday anyways. If the GOPs in congress don't get together and rescind tariffs, expect XLF to overshoot the target by a lot, lol.
Assuming no action by congress, expect market to tank Monday. No idea what happens on Tuesday.

XLF eyes on $48.xx: sem-major support that might give a bounce XLF and many big banks are a significant support zone.
Bulls need a bounce here, even if going lower after.
$48.45-48.68 is the exact zone of interest for bulls.
===============================================
.

XLF has yet to fall 4% at least XLF has yet to fall 4% at least and then maybe another 4-5 % from the SHS neckline. For now I will go one step at a time and target the neckline in a weeks time

XLF DaytradingI was way late to the party buying puts today because I thought it'd bounce when my futures indicators hit oversold, but I did catch part of the initial drop, and then re-entered the trade when SPX broke support and financials lagged a bit.
Figured XLF had to also make a new low, and the "h" pattern gave me a target around $49 - $49.05 so I flipped my puts there.
If indicators don't work, you gotta go with chart formation. That's the best you can do....

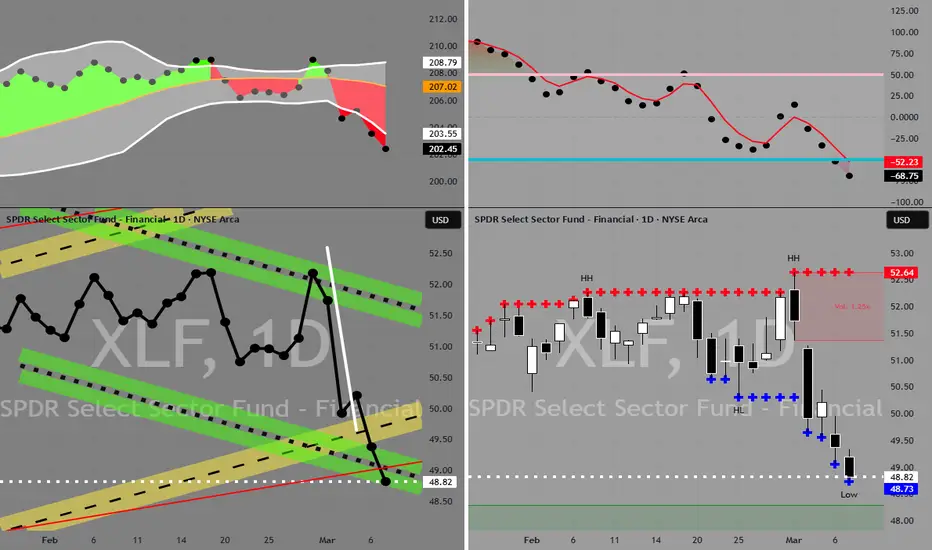
XLF in Buy ZoneMy trading plan is very simple.
I buy or sell when at three of these events happen:
* Price tags the top or bottom of parallel channel zones
* Money flow spikes beyond it's Bollinger Bands
* Stochastic Momentum Index (SMI) at near oversold overbought level
* Price at Fibonacci levels
So...
Here's why I'm picking this symbol to do the thing.
Price in buying zone below bottom of channels
Stochastic Momentum Index (SMI) at oversold level
Money flow momentum is spiked negative and under bottom of Bollinger Band
Entry at $48.82
Target is upper channel around $51
XLF Pulling BackLooks like Financial sector is pulling back. How much? Anyone can guess. I see a couple gaps back through the $46 range that needs to be filled. There is much volume coming in and the sellers are taking control. We had a break down of the sector for the past week. If it drops below the 50 day EMA it could easily retest the 100 day at $48, so a $2 spread is not a bad trade. Do your due diligence.

XLF - housing slow down in FL and AZ - bear spread and long putXLF bear spread and long put is my trade, thesis is we may be creating a double top.
Banks have run up quit abit and are far away from their book value.
Housing seems to be slowing in Florida and Arizona.
Tarriffs may muddle with international payments, at least creating desire for certainty.
Vix volatility is threatening to go higher. I dont trade vix directly.
be safe out there!

SHORT XLFThis will be one of the major to fall harder than most during this correction.
So much bad debt on the books
2007/8 ≈ 2025/6

$XLF (banks/financial sector) with a failed breakoutCouldn't hold the breakout. More downside ahead imo. Gap up would be perfect to add short pos with SL above channel...

Time to invest in the amazing SPDR ($XLF) I’m changing the process for picking tickers to make it more affordable while avoiding risky penny lots. Comment your favourite TSX tickers under $150 & NYSE or NAS under $100.
Key Stats:
• AUM: ~$38B
• Expense Ratio: 0.13%
• Yield: ~2.0%
• Recent Analyst Sentiment: Multiple upgrades with a Buy rating across major holdings
• Catalyst Note: Q1 earnings from top constituents expected to further validate sector strength
Technical Reasons for Upside:
1. Resistance Breakout: XLF has recently challenged key resistance, setting the stage for a robust upward move.
2. Bullish Momentum Indicators: A clear MACD crossover and a climbing RSI suggest that the technical momentum is shifting in favour of bulls.
3. Volume Surge: Increasing trading volumes signal heightened investor interest and confirm the strength of the emerging trend.
Fundamental Reasons for Upside:
1. Favorable Interest Rate Environment: With rising rates boosting net interest margins, the financial sector is positioned to see improved profitability.
2. Economic Recovery Boost: As the economy gains traction, banks and financial institutions—key XLF components—are expected to report stronger earnings.
3. Analyst Optimism: Recent upgrades across major holdings like JPMorgan and Bank of America reflect a growing confidence in the sector’s outlook.
Potential Paths to Profit:
1. Option 1 (Low-Risk): Buy shares of XLF at current levels and hold until the ETF reaches your target of $57.
2. Option 2 (Moderate-Risk): Purchase LEAP call options with an expiration in 6-12 months at a strike near the target price, and sell for profit as the rally unfolds.
3. Alternative Strategy: Consider a bull call spread by buying a call option at a lower strike (e.g., ~$36) and selling a call option at a higher strike (e.g., ~$58) with the same expiration. This can help manage your premium outlay while capitalizing on the upside.
Please LIKE, FOLLOW, SHARE, and COMMENT if you enjoy this idea! Also share your ideas and charts in the comments section below! This is the best way to keep this signal relevant, keep the content free, and allow the idea to reach as many people as possible.
Disclaimer: We are not a brokerage or investment firm. We do not offer financial advice or investment advice and/or signals. This is not certified financial education. We offer access to the daily thought process of an individual and his experiences. We do not offer refunds. All sales are final.

Trading Set upHere with a fourth screen set up and order entry window. Yesterday I was able to trade from TradingView and Interactive Brokers. The amount of technical indicators to chose from and the so careful design platform, to me is a lot more than a charting platform, it is a full trading solution that hard to beat.
Thanks to the creators and people who also share the technical indicators, code and knowledge, after being in several platforms, this is becoming my favorite. To make things a lot better, a second screen with the market movers gainers, is the best.

SPDR Sectors Rolling Down as Anomaly Event Sets UpSPDR sectors appear to be forming a Head-n-shoulders pattern after the US elections.
It appears the markets are stalling into a congestion phase - possibly leading to my Anomaly breakdown event.
This video will help you understand how the financial and real estate sectors could collapse to deflate the current market trend.
Get some.
#trading #research #investing #tradingalgos #tradingsignals #cycles #fibonacci #elliotwave #modelingsystems #stocks #bitcoin #btcusd #cryptos #spy #es #nq #gold
