XLF trade ideas


Update on financials: XLF2 months ago I posted on XLF suggesting the top was likely in (see link below). As I review the recent price action I think it is is mostly likely forming a triangle before a final major drop. My intermediate term target is on the daily chart. I don't know if it will stop at the long term uptrend line or go on to close the gap. Take care. Good trading to you.
PS: Notice the nice channels. Also there is a negative reversal in the daily RSI followed by a bearish divergence which I have pointed out before often leads to lower lows.

Banks woke up after FedFundamentals :
According to minutes of the Fed's latest meeting, U.S. central bankers feel it would be time to raise rates at the next Fed meeting on June 14-15 if hiring and economic growth continue to strengthen and inflation keeps rising. Higher rates are good for Banks and bad for Utilities and REITs.
Technicals :
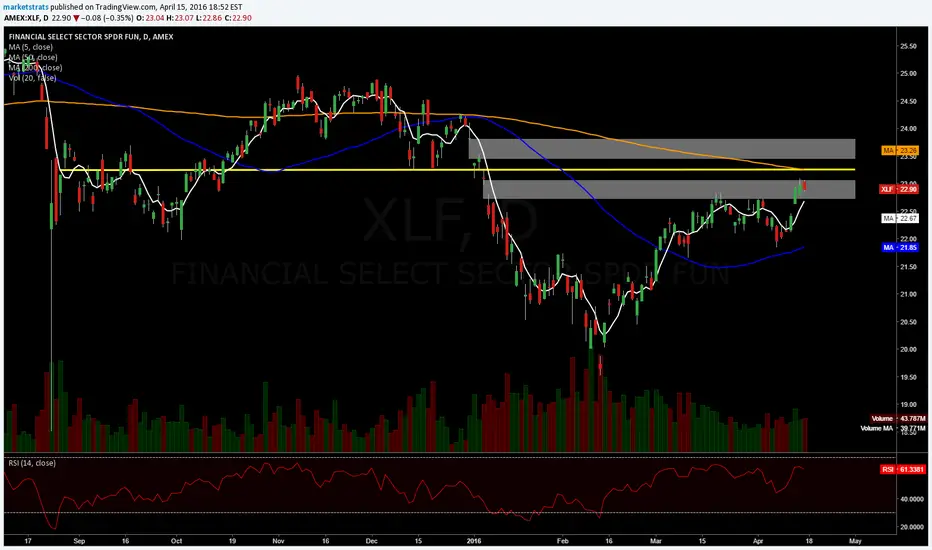
Banking sector was a laggard compare to broad market but recently has been holding near year's highs. With yeasterday's reaction to Fed's announcment, it triggered an initial Entry after break and close above trend line. I am curful here, as it is only 1 day action and could be erased.
Trade Management :
Break of bull flag triggered at $23.20 with respective stop at $23. If it builds udner the highs $23.77 new set up, I will add with Target at $24.70 (2015 highs)

XLF - first down moove to18$ and below ..... then last wave up?big down moove (few month to comlete) at least to 18$
then maybe just maybe .... 28$ as final target.
looking to buy faz above 40.3$ and then if market agrees with me I'll add more.

XLF- Which way to goI'd say closer to a short than a long, but we still need a clearer picture. A break 24.5/25 would be bullish, a break below 20 or so, bearish. THink we will move one way or the other in the coming months based on important fundos such as Spanish Election, Brexit, US election, China, etc.

Banks are starting to act better XLF long Banks are attractive here and the market as a hole is starting to look good to me im wanting to go long this week to first target zone.

XLF LongBanks are ready for the next leg up. Target for next swing would be the upper resistance level.

Two Charts That Indicate S&P 500 Sell-Off, Part 2: XLFThis is part 2 of this series. The Financials.
In Part One I pointed out a bearish 5 wave impulse pattern (with a-b-c corrective waves) nearly completed.
I also postulated the following formula:
Inter-market analysis suggests the following formula (from Don's book of logical assumptions).......
E = MC x 2. Translation: Energy = Momentum Change x 2 ( XLE momentum change and XLF momentum change). To me, both are heading lower.
The XLE looks to be heading lower. The XLF looks to be heading lower. Are these two major components going to lead the S&P-500 lower?
The evidence suggests yes.
The bearish harmonic pattern above in XLF, and the bearish harmonic pattern in XLE (Part 1) both suggest trouble ahead for the S&P-500.
Today I would like to close with a quote from Jack Yelton: “There is a very easy way to return from a casino with a small fortune: go there with a large one.”
I hope this has been helpful, entertaining, and informative. May all of your trades go well. Don.

Follow up on financialsSee post 4 days ago. Gap was closed. Bear market in financials likely starting I believe. This chart shows interesting Fibonacci relationships and channel. In EWT "B" waves not infrequently are triangles. In this case I believe an expanding triangle.
Could use this weeks high or down trend line as stop. Take care

Markets are not anticipating a Fed Rate Hike--Currently, the XLF is trading at a significant support level at 22.22s. The last time it broke this level was at the beginning of the year with significant recession risks.
-- If the XLF trades above this level, this indicates a short-term bullish outlook to the mid 20s. Could test the prior highs, especially if the FED comes out HAWKISH.
-- Risk defined at :
STOP: below 21.30s
Target Entry : 22.50
Target Exit : 24.00s
-- Markets are not pricing in a FED rate hike for March, and a surprise hike could send this to higher levels and even break former resistance levels
DISCLAIMER: Trading foreign exchange and equities on margin carries a high level of risk, and may not be suitable for all investors. Before deciding to trade foreign exchange you should carefully consider your investment objectives, level of experience, and risk appetite. The possibility exists that you could sustain a loss of some or all of your investment and therefore you should not invest money that you cannot afford to lose. You should be aware of all the risks associated with foreign exchange trading, and seek advice from an independent financial advisor if you have any doubts.

TWINS: XLF & IWM, BOTH MOVE IN TANDEMI believe IWM is setting up for the completion of a long top which is rolling over. I believe IWM will fall to about $95 before moving on to higher highs.
For those of you who chart XLF, please be aware that XLF and IWM move in tandem. If you are charting one then you are charting both.
Both are lagging, both have had technical bounces, and both need to participate in the "stock" market if we are to have a meaningful move higher.
The above chart is of XLF, but the thick bright green line is IWM. As you can see, these two issues move together.
I hope this has been helpful and informative. May all of your trades go well. Don.

Financials about to drop? The RSI-ROC I believe is even more sensitive to reversals and divergences than the RSI. When you get a negative reversal followed by a bearish divergence as we have now (and had in November) often a significant fall follows. The gap has not completely closed so there could still be a small bounce up to close it. Well see. Just the same it all looks bearish to me. Have a great and profitable week.

Financials backtesting key support after move upwardNice R/R here. @allstarcharts has a great blog post on XLF poised to outperform over intermediate time frame.

XLF banking on more buying pressureWith major bank earnings out of the way XLF have faired well and the confirmation of the break of the 200EMA coudl mean a move towards $24.50.


XLF to finish out distributionFinancials should lead the S&P to new highs as we have seen accumulation after flash drop, which resulted from 2 year distribution.


