Closed: XLK January 21st 152/181 Short Strangle... for a 1.21 debit.
Comments: Filed for a 2.42 credit (See Post Below), out today at 50% max. 1.21 ($121) profit. Nice way to end the year.
XLK trade ideas

XLKWe traded our Squeeze signal which fired 21 Dec 9:30 with a secondary trade strategy entry on 23 December. Both trades resulted in wins with the ghost feed forecast that was done on the squeeze proving to be 100% accurate on the hourly chart. Two major learns from this trade:
1) know what combination of squeeze indicators work with a high degree of probability on your particular stock - our proprietary tool looks at 6 squeeze oscillators and determines the best combination to trade. We believe that not all squeezes are equal and you should know what you are trading before doing anything.
2) wait for the entry conditions to be correct. For this trade we waited for a cross over the 21 MA while the squeeze signal remains valid for the 1st trade and we waited for our MA tool to generate a strategy entry signal before adding to the trade.
3) Let your trading platform do the heavy lifting and monitoring
4) Trust the data, your plan and your tools
Happy trading!

Opening: XLK January 21st 152/181 Short Strangle... for a 2.42 credit.
Comments: Selling 16 delta premium in the QQQ-"lite" exchange-traded fund, XLF (rank 71/30-day implied 29.7%). 2.42 max profit on buying power effect of 21.63 (on margin); 11.2% ROC as a function of buying power effect; 5.6% at 50% max.
Will look to take profit at 50% max; manage sides on approaching worthless/side test.

Engulfing Candles Menace Big TechPrice action in the market has grown more cautious, especially toward technology stocks.
The first big pattern occurred on Monday, when the SPDR Technology ETF jumped to a new all-time high above $175. But it was negative within an hour and closed the session under Friday’s low – a big bearish engulfing candle.
Similar patterns appeared on November 22 and December 1.
Next, gains have narrowed in Big Tech as Apple accounts for more of the upside. (Consider the second chart comparing XLK to AAPL.) Meanwhile former workhorses of the sector like ServiceNow and Adobe have teetered.
Finally, MACD made a lower high this month as XLK made a higher high – bearish divergence.
The weakness resembles patterns earlier in the year as bond yields jumped. This time, it occurs shortly before the Fed is expected to accelerate tapering. Is it the start of a new trend as Jerome Powell looks to unwind historic stimulus?
TradeStation is a pioneer in the trading industry, providing access to stocks, options, futures and cryptocurrencies. See our Overview for more.
Important Information
TradingView is not affiliated with TradeStation Securities Inc. or its affiliates. TradeStation Securities, Inc., TradeStation Crypto, Inc., and TradeStation Technologies, Inc. are each wholly owned subsidiaries of TradeStation Group, Inc., all operating, and providing products and services, under the TradeStation brand and trademark. When applying for, or purchasing, accounts, subscriptions, products and services, it is important that you know which company you will be dealing with. Please click here for further important information explaining what this means.
This content is for informational and educational purposes only. This is not a recommendation regarding any investment or investment strategy. Any opinions expressed herein are those of the author and do not represent the views or opinions of TradeStation or any of its affiliates.
Investing involves risks. Past performance, whether actual or indicated by historical tests of strategies, is no guarantee of future performance or success. There is a possibility that you may sustain a loss equal to or greater than your entire investment regardless of which asset class you trade (equities, options, futures, or digital assets); therefore, you should not invest or risk money that you cannot afford to lose. Before trading any asset class, first read the relevant risk disclosure statements on the Important Documents page, found here: www.tradestation.com .

XLK Crossing 168.20 Approaching resistance for a breakout.XLK Crossing 168.20
Approaching resistance for a breakout.

Technology breakoutA nice breakout towards fibo 3.0, the subbort is very close. If gowing lower the current support, fibo 2.414 next support

Elliott Wave View: Technology ETF (XLK) Looking to Break to New Short Term view in XLK suggests the rally from October 5 low is unfolding as a 5 waves impulse Elliott Wave structure. Up from October 5, wave ((i)) ended at 153.71 and pullback in wave ((ii)) ended at 149.60. Internal of wave ((ii)) unfolded as a zigzag structure. Down from wave ((i)), wave (a) ended at 150.53 and wave (b) pullback ended at 153.15. Stock then resumes lower in wave (c) which ended at 149.60. This completed wave ((ii)).
The stock has rallied higher in wave ((iii)). Internal of wave ((iii)) is unfolding as a 5 waves impulsive structure. Up from wave ((ii)), wave (i) ended at 151.61 and pullback in wave (ii) ended at 150.00. Stock has resumed higher in wave (iii) towards 156.71, wave (iv) ended at 154.61, and wave (v) of ((iii)) ended at 159.18. The pullback in wave ((iv)) has begun to correct cycle from October 12. Wave (a) ended at 157.51. Expect the ETF to bounce higher in wave (b), then we are looking down for wave (c) to complete wave ((iv)) before the rally resumes in wave ((v)). Near term, as far as wave ((ii)) pivot low at 149.60 stays intact, expect wave ((iv)) pullback to find support in 156.91 – 155.97 area for further upside.

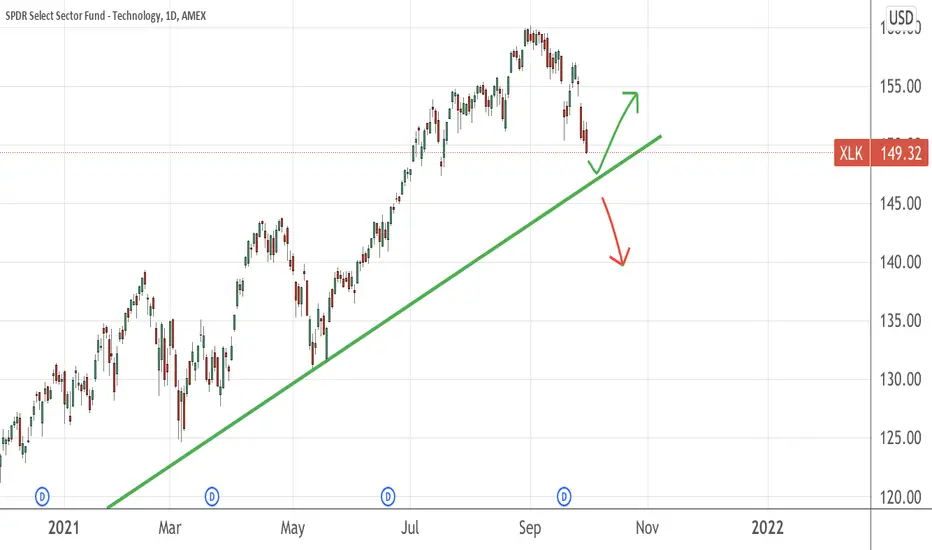
watch the trend line , if it breaks down, not goodSee day chart for this ETF
will it breaks down ? your guess is as good as mine
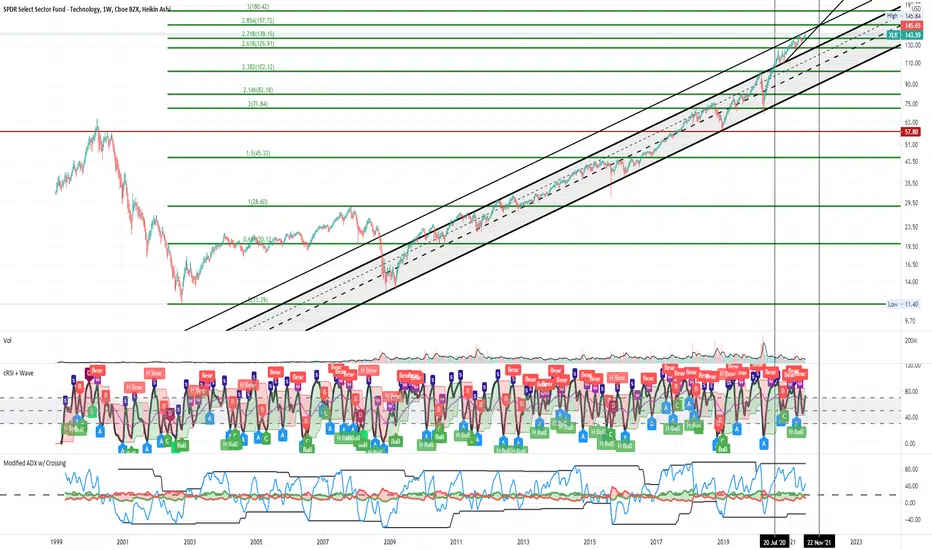
SPDR Technology (XLK) Fund - Touching top of Trading ChannelChannels that I see with the SPDR select technology fund. It was pretty well contained in this channel since 2008, but as you can see the COVID rally has pushed it way above. Right now it is in a larger parallel channel that has its mid line (red dotted) just above the major peaks since 2015. Will this channel hold Tech? HArd to tell, but so far it has been strong enough to buck an 11 year trend.
1D
4h


XLK To $144Daily chart created negative divergence with PPO. Typically that indicates weakness in the trend. Interestingly this happens to be at the upper boundary of the channel that has developed back in 2020.
Unless price bounces back this afternoon or tomorrow morning, it’s reasonable to expect some sort of the pull back. Most logical level would be just below $144 where price made previous higher high. This retest if prior highe would completely make sense from technical perspective.
AAPL update: since AAPL is big part of XLK it would mean we can see a bit of a pullback in stock as well. I previously posted price target of $130 to be reached. Not as confident in $130 at the moment, although it could definitely be reached, but $134 would be very doable.

XLK Terminal push on the upside XLK is shaping up for a terminal wave 5 increase that could reach 157 with a clear 3 wave decline into wave iv support level

I am short XLK 151.86Daily heading up into R1 152.53
Look daily vol more selling buying
Weekly starting roll over some I am early small shares Short

XLKTagged the 2.618 extension from the tech bubble crash. Covid crash happened right at the 1.618 retracement.

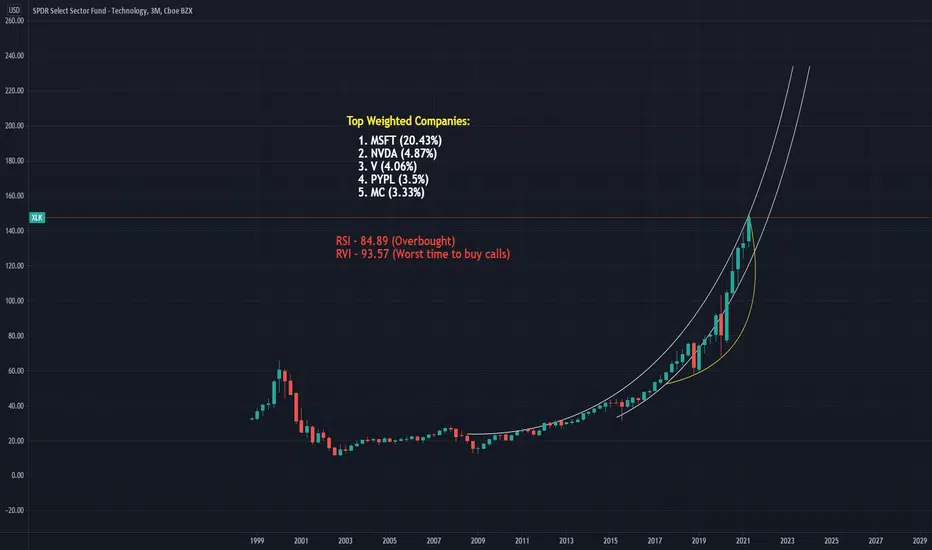
Technology overextended since July 2020 & may go until November This is about a simple as it get from a TA perspective. Tech broke the 2009 channel back and July 2020 and has not looked back since. Given its current strength and trajectory it could keep running all the way to November before we see another pullback. The air is really thin up here, but investors don't seem to care.

Rotation Out Of Energy Sector Into Technology StocksThis triangle consolidation looks to be breaking out soon. Next month we may see $XLK outperform $XLE

Trade Plan XLK 10-06-21Trade Plan XLK
Created 10-06-21
Strategy = Mean Reversal Strategy KC
Screener = CNN Business
To wait candle retrace
EP = 139.5 ; CL = 136
Risk = 3.5
TP = 142.5; TP2=146
Option Pricing
Strike Price = < >
Premium= < >; Delta = < >
Option Risk= Risk*Delta*100
Expiry Date = (>30D) DD/MM/YY
Time Stop = (1/3x D) DD/MM/YY

XLK vs SPYTech vs Spy.. Not a good look for tech yet. While we remain under that marked line, its hard to be bullish tech overall for me. Will continue to watch.

XLK Bullish Trade Setup XLK hourly chart showing a potential wave (C) pullback into testing the 50% retracement at 134 before we make the terminal move higher.

XLK (Elliott correction wave)Alot of you have been wondering how on earth I make my trades with minimalistic features on my graph. In short I only use a modified version of Elliott wave theory. I only trades Elliott correction waves. The chart of XLK is forming what looks to be a regular flat. Wait for the break of the low and a potential lower degree correction (LDC) before buying calls. Thats the strategy I use. Good day!
If you like what you see why not support us?
👇
