XLK trade ideas

Tech sector showing weakness despite gains on election dayWhen comparing tech focused ETFs/indexes, namely $NDAQ and $XLK, we can see that $SPY has recently been outperforming them. My theory is that this is an unusual case and a sign that tech stocks are near tops.
Given that I did not receive the dip I wanted, I have difficulty putting on a short position on tech. There is also the factor that the highs have not been truly swept yet.
Just something to keep an eye on.
$NDAQ/$SPY
$XLK/$SPY
For options plays, it would appear leaps for $NDAQ would be ideal, while short term plays on $XLK would work out. $NDAQ is quite illiquid.


Tech Rally resumesXLK current wave (2) correction is setting up for a terminal move into wave (3) targeting the 129-135 range.We are operating under the assumption that wave (2) should not break below 111 setting up a same degree wave 5 rally is in progress targeting 130.

XLKrevisiting the exact area you would expect it to....key now is to watch it's next move....below current support and no interest being long.


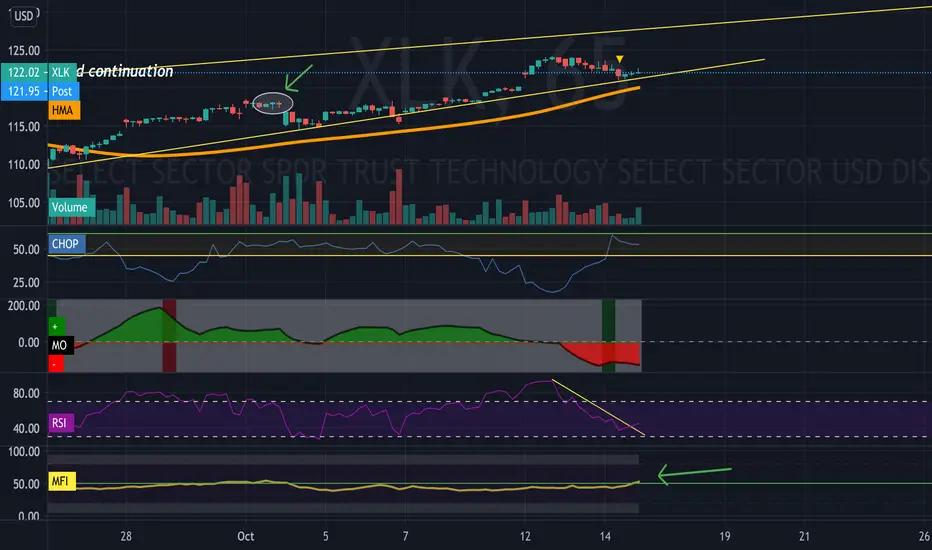
XLK showing bullish signal at 65 minutes chartNot that I am bullish on XLK but indeed I am quite bearish at this point. However the 65 minute chart does show a RSI trend break and MFI showing breaking up the 0 line which mean trend bullish, even though these two signals need confirmation.
Cautious with positioning with these signals is what I want to convey.
Disclaimer, this is only for entertainment and education purposes and doesn't serve by any means as a buy or sell recommendation.
Personally I hold both long term long positions and occasionally short term short position, for disclosure purpose.
XLK trend line on edge of being brokenXLK breaking trend line on 60 minutes and lower time frame. 2 hour still holding up OK.
Qs are holding up still. CLosely watch the unfolding.
Bearsih divergence + broken trend line is NOT a good combo for XLK at this moment. May reverse and continue higher but this is a warning.
Disclaimer, this is only for entertainment and education purposes and doesn't serve by any means as a buy or sell recommendation.
Personally I hold both long term long positions and occasionally short term short position, for disclosure purpose.

30 minutes view for XLKShowing this is a great shorting opportunity that might disappear quickly...
see my previous post for RR setting.
In this kind of choppy phase, momentum indicators are all wasted. use volume based indicators such as OBV and MFI.
Disclaimer, this is only for entertainment and education purposes and doesn't serve by any means as a buy or sell recommendation.
Personally I hold both long term long positions and occasionally short term short position, for disclosure purpose.

entering short XLKPre market gap up.
Divergence obvious. volume based indicator MFI up and OBV down. so this is a half half short trade. set stop at right above hullma with RR of 3.
Looks like a worthy trade to me.
let's see how this will play out.
Disclaimer, this is only for entertainment and education purposes and doesn't serve by any means as a buy or sell recommendation.
Personally I hold both long term long positions and occasionally short term short position, for disclosure purpose.


30 minutes view for XLKbearish setup.
Disclaimer, this is only for entertainment and education purposes and doesn't serve by any means as a buy or sell recommendation.
Personally I hold both long term long positions and occasionally short term short position, for disclosure purpose.


XLK pitchforks
Disclaimer, this is only for entertainment and education purposes and doesn't serve by any means as a buy or sell recommendation.


money moving from TECH to healthcare Retail Airlines restaurantsmoney $$ is moving from TECH to healthcare Retail Airlines restaurants
stay away from Boeing company needs a rebirth
Wait till mid / end of october for tech entry

XLK broke out of upward channelLook for XLK to retest what was once the support line at $114 . First target is $104 (the high from February) and the 2nd target is $100. The bears are in control, so look at this as a shift from a bull market to a bear market going into the end of the year. Long term target is low 90's to high 80's.

XLK direction Recent tech sell off from recent parabolic move.
Monthly charts shows key levels and like area price will gravitate to. Can play the bounce off these levels or continuation.

XLK Bullish Channel Holds for Tech The channel provided good support, actual first test of the bottom end of the channel since the low in March. Tech took a brutal beating last week with a disgusting weekly candle. However, the recovery this week has been extremely strong. Until the channel breaks, there should be some expectation of a bullish move to the upside. Only if the channel breaks would there be a break from the overall bull trend and a possible larger correction to the downside. If that takes place, then I expect at least the gap to be filled at 110 (red outline box) or even more of a correction to test the February 20 highs.
On the hourly, a clear bullish RSI divergence played out, making the price action look somewhat like a wedge breakout. But then resistance was found today at a parallel level to the recent lower lows, so now lower highs which means short term bearish. If a higher high can be set and a S/R flip accomplished, see below, then it would be a good spot for a call play to retest just short of the highs.
Game plan is seen in the hourly chart below.


XLK (+11.82%) & XLU (-1.45%) [Hold) for Sept 1, 2020Holding both XLK and XLU from my original entries given on my channel--linked below.


