GoNoGo Charts: Can Technology continue to dominate?The technology sector has outperformed on a relative basis in 2020. Tech stocks in general were hit less hard by the COVID-19 pandemic and have rallied quicker and further than the rest of the market since the lows in March.
Right now, the five largest stocks by market cap in the S&P 500 are Microsoft, Apple, Amazon, Facebook and Google. And between them, they make up around 20% of the index.
They have been the drivers of the current post crash move. So what happens if technology starts to struggle? Is it time to protect against downside risk?
The above chart is the daily GoNoGo chart of the Technology sector Spyder, XLK. While it is still in a “Go” trend, there are some signs of troubled water ahead.
Price has fallen below an upward sloping trend line, and could likely now find it to be resistance. In doing so, it looks to have made a lower swing low.
If we look at the GoNoGo Oscillator in the lower panel, we see strong *bearish divergence. While price has continued to make higher highs, the oscillator has not confirmed, instead making successive lower highs.
We are at an inflection point, with the GoNoGo Oscillator resting at zero. We would need to see this hold as support and then bounce off zero if the “Go” trend is to persist. If the oscillator fails at zero, breaking into negative territory, we expect price to correct further, potentially leading to a change in the GoNoGo Trend above.
XLK trade ideas

Technology Sector Remain CautiousWeekly and Monthly remain bullish and uptrend.
-- Nasdaq --
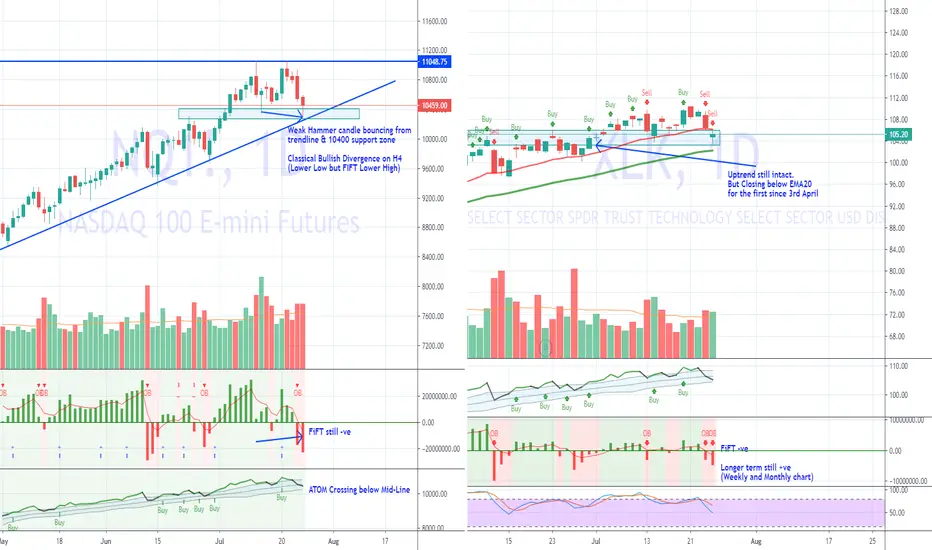
+ Daily chart - Weak hammer candle bouncing from trendline and 10400 support zone.
+ Sign of Classical Bullish Divergence seen on H4
- FiFT still -ve
- ATOM crossing below mid line.
-- XLK (US Tech sectors) --
Uptrend still intact but index close below EMA20 for the first time since 3rd April.
ATOM crossing below midline and FiFT remain -ve on daily chart..
Summary
Remain cautious with technology sector. Hit & Run or take partial profit when hit certain target is probably a good strategy ..
However, it will be an opportunity to buy low if Nasdaq and XLK able to bounce from key support zone / trendline.

XLK EXTREME TOP. IS THE BUBBLE ABOUT TO BURST?This chart shows the ratio between XLK (Technology) and XLF (Financials).
When the chart is going up the the indicator is saying go long technology.
Sideways then equal weighting.
Chart going down then overweight XLF, lighten up on XLK.
It also shows that the current situation is that XLK is at a top. In fact it is significantly above the DOT COM bubble of 2000.
Will XLK reverse from here and XLF start to pick up?

Support = Buy , Resistance = Sell, is it correct ?I was too naive to think that after reviewing 10 to 20 charts and seeing a pattern where price bounce off from support and retrace from resistance, I formed a bias view to buy at support and sell at resistance.
Of course, over the long haul, my results proved that I was wrong. On certain occasions, I would like to think I probably enjoyed a stroke of luck to get them right by following this train of thoughts.
I have often said the Market is way too smart to be predicted and it is a futile exercise (at least for me). From this XLK chart, we can see that it has just break out of the resistance level at 102.74 and the last bullish candle signals it would continue to trend higher.
I use Amazon chart as an example to illustrate. If one thinks that upon resistance, the price MUST falls, then they would have missed another 27% returns.


!CRB long entry; !XLK Short entry: 13:04:22 (UTC) Wed Jul 8, 202!CRB long entry; !XLK Short entry: 13:04:22 (UTC) Wed Jul 8, 202


$XLK First Red Day Short IdeaXLK looks really good for new 52 highs but with Dividends being paid out today, looking for a slight pull back to $101s. In a better market environment I would not be Bearish, but I will turn Bullish if breakout above $104.
Tech is a bit overvalued in my opinion, but looks like folks seem okay paying overvalued.


Cycles Eh?Technology vs. Consumer Discretionary
Are we about to see a significant change in the performance of this ratio? CD outperforming wouldn't necessarily spell trouble for the broad market, but is it seriously time to consider being underweight tech?

XLK - 2 bearish (and 1 bullish) counts for US tech stocksIt might look a bit foolish to bet against US tech with the action of the last 11 (even 20+) years but both these counts reckon there might be room for a decent correction (blue count) and for a much larger and prolonged correction (red count) . (There is another variation for the red count that suggests the correction that began in 2018 finished a running flat in March 2020 and what we are experiencing now is in fact the early stages of wave 5.) Personally, I like the blue count......


GoNoGo senses moment of truth for technologyWhat’s next for the technology sector?
Technology has been the leader this year, outperforming the S&P 500 throughout the volatile market reactions to Covid-19.
This week saw the sector fail at prior highs and yesterday’s price bar showed a weakening in the GoNoGo Trend.
Look to the GoNoGo Oscillator at this critical juncture. When in a strong trend, remember, the Oscillator should find support/resistance at the zero line. You can see this throughout the time period.
This is a non subjective level because it means that all momentum is neutral. In a strong uptrend for example, enthusiasm should pick up, and the GoNoGo Oscillator should rally off the zero line helping price make a new leg up.
If the GoNoGo Oscillator cannot stay positive and breaks below zero, then we expect price to struggle and the “Go” trend to really be threatened.


XLK doughAnalysis done on 25/05/2020
Fundamental
→ 20 & 40 SMA sloping up
→ 20MA > 40MA
Awaiting buy trigger
→ CCI <-100
→ Low of daily bar touches 20MA or goes below 20MA
→ Close above 40MA
Pull trigger
→ Buy 1 bid above previous day high
→ Sell 5 bars later exclusive of initial bar
Stop Loss
→ 50% below price bought

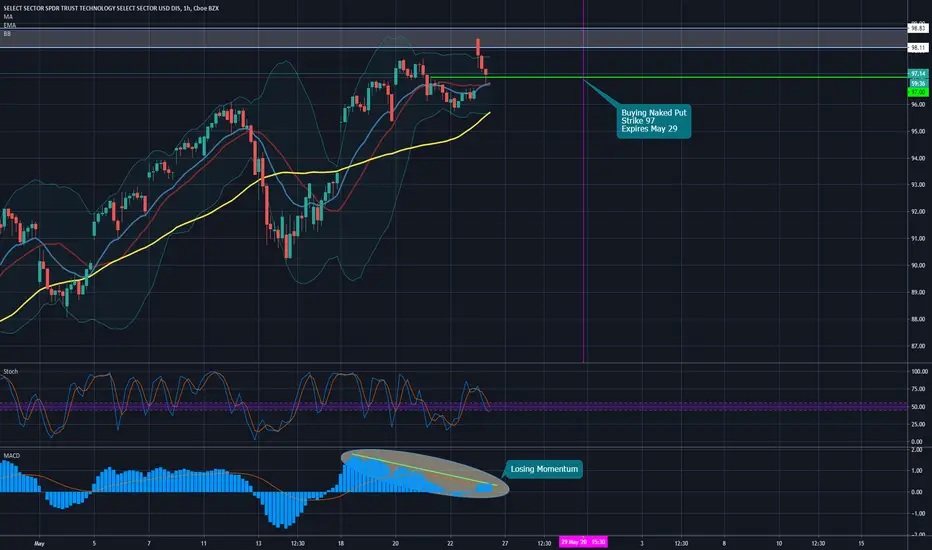
Weekly Naked Puts for XLKMACD shows the loss of momentum for the uptrend at the key resistance level, with an additional confirmation of divergence on the stochastic.
I assume market could be going south from here.
The concern for the trade is EMA(15) might act as a support. That's a factor that adds to the risk of this trade.
VIX breaks below 30 - Tech and Healthcare sector strongest.VIX breaks below 30 for the first time since Covid19 outbreak.
Tech sector and Healthcare sector remain strongest.
Should be a good week for stock market. (Bull might pause when VIX hit 24)

Tech vs FinancialsNothing but new highs in Tech vs Financials... Not likely to see a reversal in the trend of growth over value if this ratio keeps trending higher. $XLK > $XLF
Click the related idea link to see our long term chart of Broker-Dealers & Exchanges. This important and leading subsector is now trapped beneath significant overhead supply So are Banks, both of which are dragging on $XLF itself. Meanwhile, Tech and many of its subsector groups are getting awfully close to retesting their all-time highs.
Basically, we're seeing no evidence of this trend reversing, we're seeing just the opposite.

