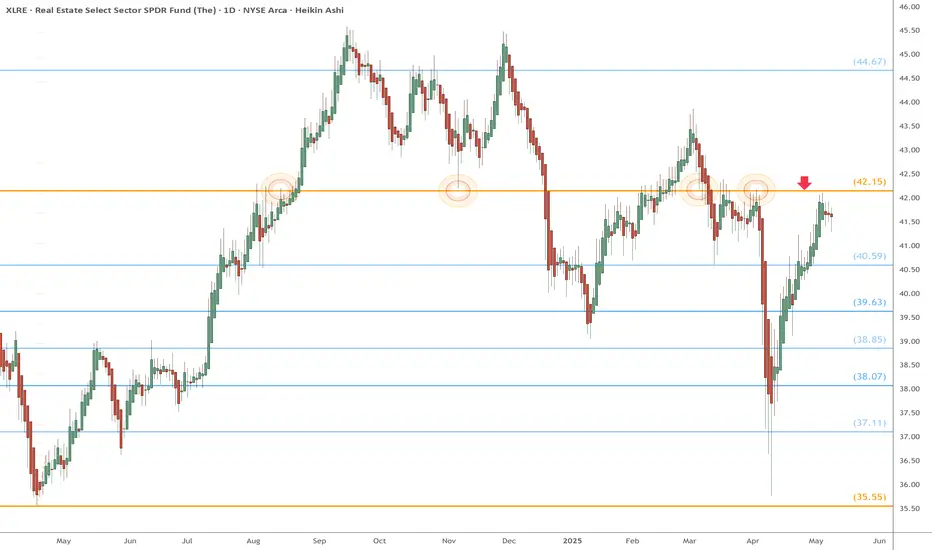
XLRE watch $42.15: proven Golden Genesis fib to determine TrendXLRE (Real Estate) has bounced back strong.
BUT just hit a Golden Genesis fib at $42.15
Look for a likely dip to one of the fibs below.
Key stats
About SELECT SECTOR SPDR TRUST
Home page
Inception date
Oct 7, 2015
Structure
Open-Ended Fund
Replication method
Physical
Dividend treatment
Distributes
Distribution tax treatment
Ordinary income
Income tax type
Capital Gains
Max ST capital gains rate
39.60%
Max LT capital gains rate
20.00%
Primary advisor
SSgA Funds Management, Inc.
Distributor
ALPS Portfolio Solutions Distributor, Inc.
XLRE launched in October 2015, following a decision by S&P and MSCI to split the GICS financial sector into two new sectors: financials and real estate. Due to this update, sibling fund XLF spun-off its real estate exposure to this fund. XLRE represents the new real estate sector, although mortgage REITs remain in the financial sector. Like the rest of the sector SPDR suite, it holds a concentrated portfolio of mostly large-caps. The index is rebalanced quarterly.
Related funds
Classification
What's in the fund
Exposure type
Finance
Stock breakdown by region
Top 10 holdings
The Anomaly Price Event May Hit Before December 31Just before the US Presidential Elections, I published a detailed research report suggesting the markets may move into a low-liquidity event that could be very dangerous for traders.
My Adaptive Dynamic Learning (AI) predictive modeling system highlighted a range of price volatility just after the

Fed rate cut sector watchHere's a Fed rate cut sector watch split view charts with TTCATR and FibTSI indicators. On Wednesday 9/18/24 at 2pm, the FOMC is forecast to cut the interest rate .25 from 5.5% down to 5.25%. The sectors that could benefit the most from a .25 rate cut are utilities, real estate and consumer discreti

Markets Finding Equilibrium Before FOMCAll major indexes and broad market advancing today with the US CPI/PPI combo causing some big recoveries since the post Labor Day selloff.
Momentum goes to the bulls for now until price proves otherwise. FED likely to cut 25 bps next week with more to come by end of year. It's amazing how quickly s

XLREReal Estate Sector SPDR Fund!
DOWN, DOWN, DOWN
As soon as it break horizontal line we see Target by Arrow!

XLRE Weekly Chart Okay so real estate broke out of its down trend November of last year, and its been pretty much trading sideways ever since. Call me crazy but this level seems real important to me. In MY OPINION, not a fact, XLRE needs a strong push and close above this level to even touch this sector. Do I really

1/25/24 Sector Watch1/25/24 Sector Watch:
XLK Technology
XLE Energy
XLV Health Care
XLF Financials
XLB Materials
XLY Consumer Discretionary
XLU Utilities
XLRE Real Estate
Communication Services XLC, Consumer Staples XLP, Industrials XLI.
Economic Calendar results 1/25/24
Actual Forecast Previous
Core Durable Goods Or

Real Estate Sector AVWAP Squeeze PatternThe real-estate sector is in an AVWAP squeeze pattern. Look for a break out above $38.90


XLRE: Support and resistanceAMEX:XLRE
Let's see if Real estate is going for a correctio or it has gas to go up again.
Looks like a stagnation or correction for a long period.
If FED starts printing, expect it to go higher.
My theory:
1. Correction into FED pause.
2. Quick downside into FED rate cut.
3. Start the bull run ag

See all ideas
Summarizing what the indicators are suggesting.
Oscillators
Neutral
SellBuy
Strong sellStrong buy
Strong sellSellNeutralBuyStrong buy
Oscillators
Neutral
SellBuy
Strong sellStrong buy
Strong sellSellNeutralBuyStrong buy
Summary
Neutral
SellBuy
Strong sellStrong buy
Strong sellSellNeutralBuyStrong buy
Summary
Neutral
SellBuy
Strong sellStrong buy
Strong sellSellNeutralBuyStrong buy
Summary
Neutral
SellBuy
Strong sellStrong buy
Strong sellSellNeutralBuyStrong buy
Moving Averages
Neutral
SellBuy
Strong sellStrong buy
Strong sellSellNeutralBuyStrong buy
Moving Averages
Neutral
SellBuy
Strong sellStrong buy
Strong sellSellNeutralBuyStrong buy
Displays a symbol's price movements over previous years to identify recurring trends.
Frequently Asked Questions
An exchange-traded fund (ETF) is a collection of assets (stocks, bonds, commodities, etc.) that track an underlying index and can be bought on an exchange like individual stocks.
XLRE trades at 41.73 USD today, its price has fallen −0.83% in the past 24 hours. Track more dynamics on XLRE price chart.
XLRE net asset value is 42.78 today — it's risen 2.30% over the past month. NAV represents the total value of the fund's assets less liabilities and serves as a gauge of the fund's performance.
XLRE assets under management is 7.78 B USD. AUM is an important metric as it reflects the fund's size and can serve as a gauge of how successful the fund is in attracting investors, which, in its turn, can influence decision-making.
Since ETFs work like an individual stock, they can be bought and sold on exchanges (e.g. NASDAQ, NYSE, EURONEXT). As it happens with stocks, you need to select a brokerage to access trading. Explore our list of available brokers to find the one to help execute your strategies. Don't forget to do your research before getting to trading. Explore ETFs metrics in our ETF screener to find a reliable opportunity.
XLRE invests in stocks. See more details in our Analysis section.
XLRE expense ratio is 0.09%. It's an important metric for helping traders understand the fund's operating costs relative to assets and how expensive it would be to hold the fund.
No, XLRE isn't leveraged, meaning it doesn't use borrowings or financial derivatives to magnify the performance of the underlying assets or index it follows.
In some ways, ETFs are safe investments, but in a broader sense, they're not safer than any other asset, so it's crucial to analyze a fund before investing. But if your research gives a vague answer, you can always refer to technical analysis.
Today, XLRE technical analysis shows the buy rating and its 1-week rating is buy. Since market conditions are prone to changes, it's worth looking a bit further into the future — according to the 1-month rating XLRE shows the buy signal. See more of XLRE technicals for a more comprehensive analysis.
Today, XLRE technical analysis shows the buy rating and its 1-week rating is buy. Since market conditions are prone to changes, it's worth looking a bit further into the future — according to the 1-month rating XLRE shows the buy signal. See more of XLRE technicals for a more comprehensive analysis.
Yes, XLRE pays dividends to its holders with the dividend yield of 3.23%.
XLRE trades at a premium (1.26%).
Premium/discount to NAV expresses the difference between the ETF’s price and its NAV value. A positive percentage indicates a premium, meaning the ETF trades at a higher price than the calculated NAV. Conversely, a negative percentage indicates a discount, suggesting the ETF trades at a lower price than NAV.
Premium/discount to NAV expresses the difference between the ETF’s price and its NAV value. A positive percentage indicates a premium, meaning the ETF trades at a higher price than the calculated NAV. Conversely, a negative percentage indicates a discount, suggesting the ETF trades at a lower price than NAV.
XLRE shares are issued by State Street Corp.
XLRE follows the S&P Real Estate Select Sector. ETFs usually track some benchmark seeking to replicate its performance and guide asset selection and objectives.
The fund started trading on Oct 7, 2015.
The fund's management style is passive, meaning it's aiming to replicate the performance of the underlying index by holding assets in the same proportions as the index. The goal is to match the index's returns.