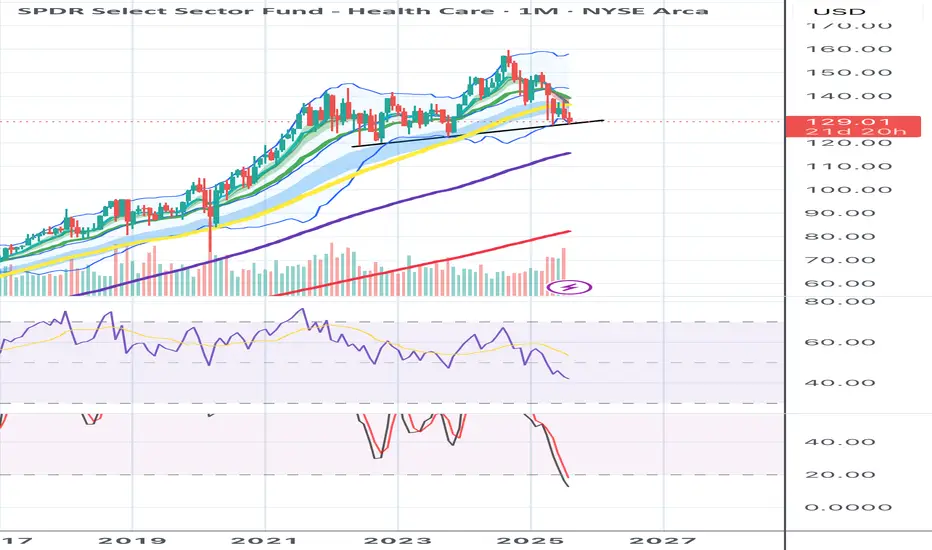
XLV SHORTMonthly chart - Head and shoulders pattern with a break below neckline and 200MA. Target for the pattern is around 118 looking to pick up long term shares there.
Key stats
About SELECT SECTOR SPDR TRUST
Home page
Inception date
Dec 16, 1998
Structure
Open-Ended Fund
Replication method
Physical
Dividend treatment
Distributes
Distribution tax treatment
Qualified dividends
Income tax type
Capital Gains
Max ST capital gains rate
39.60%
Max LT capital gains rate
20.00%
Primary advisor
SSgA Funds Management, Inc.
Distributor
ALPS Distributors, Inc.
XLV dominates the US health care segment on practically every measure. The fund provides exposure to companies in pharmaceuticals, health care equipment and supplies, health care providers and services, biotechnology, life sciences tools and services, and health care technology industries. XLV is the oldest in the segment, as such it is used widely for strategic or tactical positions. Since XLV is both cap weighted and fishes only from the S&P 500, it tilts heavily toward mega-caps. For focused exposure to leading health care names, XLV is tough to beat.
Related funds
Classification
What's in the fund
Exposure type
Health Technology
Stock breakdown by region
Top 10 holdings

Getting your ammunition to buy XLV ETFI expect the price to continue to head south in the coming weeks and find support at 119-123 price level. Then, it would have fallen 25% from the peak and hopefully, at this support level, we can see a turnaround in the price movement.
It is also possible that prices may fall a bit further below th

Healthcare bottomed (or only 0-3% away). AMEX:XLV has the most oversold readings since 2008.
- Specifically, the 1M slow stochastic is actually MORE oversold now then it was in 2007.
- We are sitting at a major trend line support. There’s plenty of 1-2M hammer candles along this area as well.
- we have pierced the Monthly Bollinger
XLV BreakoutThe XLV is breaking out after testing the $147-$148 area as resistance since late February. It finally broke out recently and came back down to retest the area as support yesterday, successfully. 1st Upside target is $157, followed by $162 for a secondary target. As markets are falling this week, he

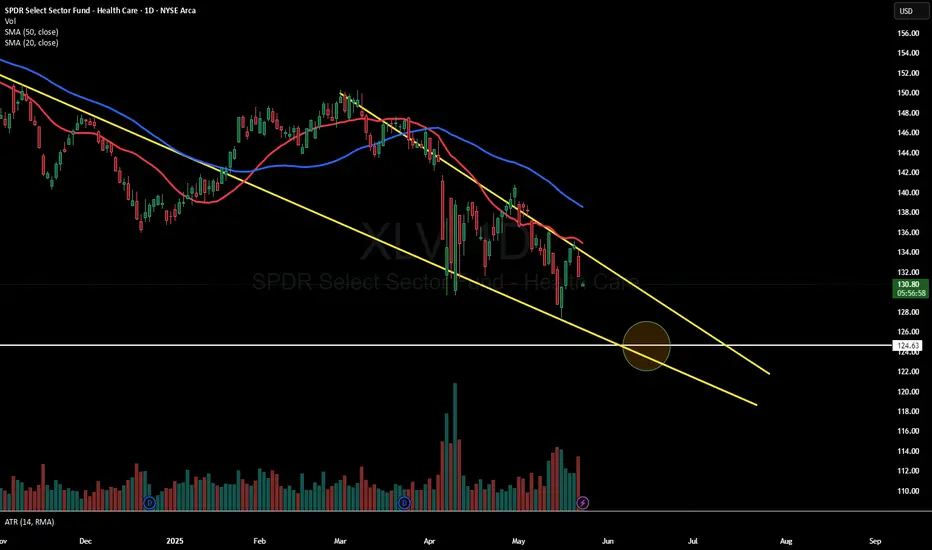
$XLV – Bearish Options TradeTook a defined-risk, bearish position targeting $124 by mid-June.
Set up for max loss if wrong — thesis based on price action + macro bias.
Let’s see if it breaks down.
XLV Stock Chart Fibonacci Analysis 061025Trading Idea
1) Find a FIBO slingshot
2) Check FIBO 61.80% level
3) Entry Point > 136/61.80%
Chart time frame:D
A) 15 min(1W-3M)
B) 1 hr(3M-6M)
C) 4 hr(6M-1year)
D) 1 day(1-3years)
Stock progress:B
A) Keep rising over 61.80% resistance
B) 61.80% resistance
C) 61.80% support
D) Hit the bottom
E)

$XLV - Long Calls (Sept)I picked up calls for September based on price action and key control levels. The stock has been in a downtrend and recently tested significant support levels on both a monthly and weekly basis. Considering the slow price movement and that the recent decline was driven by fundamental factors, I'm ta

Short Setup for Weak Healthcare Sector- Current Price: $132.68
- Price Targets:
- **T1**: $129.66
- **T2**: $127.98
- **S1**: $134.70
- **S2**: $137.56
- Recent Performance:
Healthcare Sector ETF (XLV) has declined 4.22% in the past week, breaking
beneath key support levels. On an annual basis, the ETF has plunged 29%,
reflecti

XLV Stock Chart Fibonacci Analysis 042925Trading Idea
1) Find a FIBO slingshot
2) Check FIBO 61.80% level
3) Entry Point > 135/61.80%
Chart time frame: C
A) 15 min(1W-3M)
B) 1 hr(3M-6M)
C) 4 hr(6M-1year)
D) 1 day(1-3years)
Stock progress: A
A) Keep rising over 61.80% resistance
B) 61.80% resistance
C) 61.80% support
D) Hit the bottom

Trading idea - Entry point > 136/61.80%Trading Idea
1) Find a FIBO slingshot
2) Check FIBO 61.80% level
3) Entry Point > 136/61.80%
Chart time frame: D
A) 15 min(1W-3M)
B) 1 hr(3M-6M)
C) 4 hr(6M-1year)
D) 1 day(1-3years)
Stock progress: A
A) Keep rising over 61.80% resistance
B) 61.80% resistance
C) 61.80% support
D) Hit the bottom

See all ideas
Summarizing what the indicators are suggesting.
Oscillators
Neutral
SellBuy
Strong sellStrong buy
Strong sellSellNeutralBuyStrong buy
Oscillators
Neutral
SellBuy
Strong sellStrong buy
Strong sellSellNeutralBuyStrong buy
Summary
Neutral
SellBuy
Strong sellStrong buy
Strong sellSellNeutralBuyStrong buy
Summary
Neutral
SellBuy
Strong sellStrong buy
Strong sellSellNeutralBuyStrong buy
Summary
Neutral
SellBuy
Strong sellStrong buy
Strong sellSellNeutralBuyStrong buy
Moving Averages
Neutral
SellBuy
Strong sellStrong buy
Strong sellSellNeutralBuyStrong buy
Moving Averages
Neutral
SellBuy
Strong sellStrong buy
Strong sellSellNeutralBuyStrong buy
Displays a symbol's price movements over previous years to identify recurring trends.
Frequently Asked Questions
An exchange-traded fund (ETF) is a collection of assets (stocks, bonds, commodities, etc.) that track an underlying index and can be bought on an exchange like individual stocks.
XLV trades at 134.53 USD today, its price has risen 0.85% in the past 24 hours. Track more dynamics on XLV price chart.
XLV net asset value is 130.15 today — it's risen 1.04% over the past month. NAV represents the total value of the fund's assets less liabilities and serves as a gauge of the fund's performance.
XLV assets under management is 31.55 B USD. AUM is an important metric as it reflects the fund's size and can serve as a gauge of how successful the fund is in attracting investors, which, in its turn, can influence decision-making.
XLV price has fallen by −1.77% over the last month, and its yearly performance shows a −7.73% decrease. See more dynamics on XLV price chart.
NAV returns, another gauge of an ETF dynamics, showed a −1.07% decrease in three-month performance and has decreased by −7.57% in a year.
NAV returns, another gauge of an ETF dynamics, showed a −1.07% decrease in three-month performance and has decreased by −7.57% in a year.
Since ETFs work like an individual stock, they can be bought and sold on exchanges (e.g. NASDAQ, NYSE, EURONEXT). As it happens with stocks, you need to select a brokerage to access trading. Explore our list of available brokers to find the one to help execute your strategies. Don't forget to do your research before getting to trading. Explore ETFs metrics in our ETF screener to find a reliable opportunity.
XLV invests in stocks. See more details in our Analysis section.
XLV expense ratio is 0.09%. It's an important metric for helping traders understand the fund's operating costs relative to assets and how expensive it would be to hold the fund.
No, XLV isn't leveraged, meaning it doesn't use borrowings or financial derivatives to magnify the performance of the underlying assets or index it follows.
In some ways, ETFs are safe investments, but in a broader sense, they're not safer than any other asset, so it's crucial to analyze a fund before investing. But if your research gives a vague answer, you can always refer to technical analysis.
Today, XLV technical analysis shows the sell rating and its 1-week rating is sell. Since market conditions are prone to changes, it's worth looking a bit further into the future — according to the 1-month rating XLV shows the sell signal. See more of XLV technicals for a more comprehensive analysis.
Today, XLV technical analysis shows the sell rating and its 1-week rating is sell. Since market conditions are prone to changes, it's worth looking a bit further into the future — according to the 1-month rating XLV shows the sell signal. See more of XLV technicals for a more comprehensive analysis.
Yes, XLV pays dividends to its holders with the dividend yield of 1.84%.
XLV trades at a premium (0.22%).
Premium/discount to NAV expresses the difference between the ETF’s price and its NAV value. A positive percentage indicates a premium, meaning the ETF trades at a higher price than the calculated NAV. Conversely, a negative percentage indicates a discount, suggesting the ETF trades at a lower price than NAV.
Premium/discount to NAV expresses the difference between the ETF’s price and its NAV value. A positive percentage indicates a premium, meaning the ETF trades at a higher price than the calculated NAV. Conversely, a negative percentage indicates a discount, suggesting the ETF trades at a lower price than NAV.
XLV shares are issued by State Street Corp.
XLV follows the S&P Health Care Select Sector. ETFs usually track some benchmark seeking to replicate its performance and guide asset selection and objectives.
The fund started trading on Dec 16, 1998.
The fund's management style is passive, meaning it's aiming to replicate the performance of the underlying index by holding assets in the same proportions as the index. The goal is to match the index's returns.