A closer look at the action. Local levels have been tried and reacted strongly. Is it a giant fake out and dead cat bounce? Or was that just a correction?
BVOL24H trade ideas

It's a long way to the topIf the ttm squeeze momentum is anything to go by, we might have seen one of the last lows for a while. Of course, there's more at play here than simple momentum.

BTC PennantBTC might look scary on lower time frames but dear hodlers please look at this long term idea :)

An evening star in BTC's monthly chart A possible evening candle is visible in BTC's monthly chart which is now followed by a very strong bearish candle.
📌 We still have 4 days to close the monthly candle.
📌 My predication is BTC's rise to 46-47k level, then we may again retest the 30-32k resistance levels.
⚠️ THIS IS NOT A FINANCIAL ADVICE !

Alarming sign in the Weekly chartLooking at the weekly chart of the bitcoin shows whenever we have a bearish Outside bar in the weekly chart, there will be a 12- 25% decline in the following week!
If you look at the mid-July weekly candle, you see after a bullish reversal out bar crypto market went up 49%.
Take weekly outside bars seriously..!
What Is an Outside Reversal?
An outside reversal is a price pattern that indicates a potential change in trend on a price chart. The two-day pattern is observed when a security’s high and low prices for the day exceed the high and low of the previous day’s trading session. Outside reversal is also known as either a bullish engulfing (after a downward price move) or a bearish engulfing pattern (after an upward price move) when observed on candlestick charts.
Reference article:
www.investopedia.com


Broke parabolas in BTCWhen the parabolas break in BTC, they break. Declines over next 200-300 days likely. Good news is that BTC may have a fire sale in December.

Cathie Wood predicted Bitcoin will be 500 k in 5 years, but ...In the past 24 hours, all crypto enthusiasts talk about " Cathie Wood predicted Bitcoin will be 500 k in 5 years".
But she mentioned two Ifs:
1- Her price prediction depends on whether companies continue to diversify their balance sheets into bitcoin, the biggest cryptocurrency by market value, and whether institutional investors begin to allocate 5% of their funds to it.
2-She said, "because countries are now deeming it legal tender." El Salvador recently made bitcoin legal currency, while Panama and Ukraine are said to be doing the same.
Now, let's dig deeper into this:
In 2020, GDP for El Salvador was 24.61 billion US dollars. Ranked 103 in the world. Very, Very, Very small (less than 3% of Bitcoin market cap)
In 2020, the GDP for Ukraine was 153.8 billion US dollars. Ranked 57 in the world. (less than 16% of Bitcoin market cap)
In 2020, GDP for Panama was 53 billion US dollars. Ranked 70 in the world. Very, Very, Very small (less than 6% of Bitcoin market cap)
Cryptocurrency adaptation:
At the end of Q2 2021, global adoption has grown by over 2300% since Q3 2019 and over 881% in the last year.
But the biggest problem is " Bitcoin losing its dominance in the cryptocurrency world and smaller market cap coins are more attractive for new crypto enthusiasts!
In other words, People have already started looking for the next bitcoin..!
Solana
Cardano
Chainlink
could be good examples for this effort..!
Bitcoin Market dominance Chart:
This chart clearly shows bitcoin losing its dominance..!
I believe anyone who believes Bitcoin could reach 500 K in 5 years should be able to answer these questions:
1- How many government-backed cryptocurrencies we will have in the next 5 years?
2- How many Business giants (Apple, Google, Amazon, Facebook,... ) backed cryptocurrency we will have in the next 5 years?
3- What would be the rate of adaptation in the next 5 years?
4- what would be the Bitcoin market dominance in the next 5 years?
The answer to the first 3 questions is not clear, but I can talk about the last question.
Bitcoins market dominance trend shows, bitcoin losing its market cap dominance constantly and in the next five years, it is highly likely that this number shrinks more..!
I believe only impossible is impossible, but mathematically Bitcoin will not be able to reach 10,000,000,000,000 market cap (10 Trillion US dollars) in the next 5 years!
If you want to know how big this number is:
There is approximately US$ 40 trillion in circulation: this includes all the physical money and the money deposited in savings and checking accounts.
Total money in the stock market, which is a mere $95 trillion.
Gold's Market Cap
Estimated Market Cap: $11.401 T
The Market Capitalization of Gold is currently around $11.401 T.
This value was obtained by multiplying the current gold price ($1,795 per once) with the world's above-ground gold reserves.
The amount of above-ground reserves for Gold are estimated to be around 197,500 metric tonnes according to the World Gold Council (End-2019). Note that the estimated above-ground Gold reserves can vary by up to 20% from one source to another.
As a consequence, it is safe to say that the current Market Cap of Gold is between $9.121 T and $13.682 T.
10 Trillion dollars is almost equal to the total Gold in the world!
Apple market cap: 2.4 Trillion dollars
Microsoft: 2.2 trillion dollars
As of March 31, 2021, there was nearly US $2.1 trillion in circulation, including Federal Reserve notes, coins, and currency no longer issued. (rankred.com)
The final question for Cathie Wood:
Cathie Wood loves Palantir and claim they have the best AI technology in the world (which could be true).
Palantir has bought 50 million dollars of physical gold recently, while they are discussing the future of bitcoin..!
Why Palantir did not buy Bitcoin instead of Gold???
Numbers do not lie..!
Reference article:
www.rankred.com


BTC is still inside descending parallel channelFor a bullish scenario, we need to break up the upper line of the channel with strong volume and retest it (with a candlestick close above the $46500).

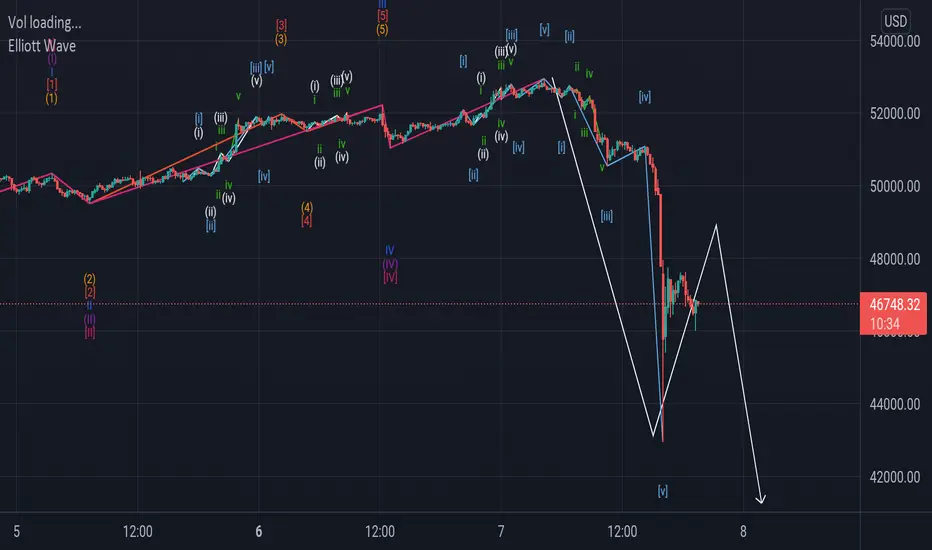
BTC daily Elliott wave countI think after making 5 wave we have a wave a down and price will range around 45000 than making c wave down

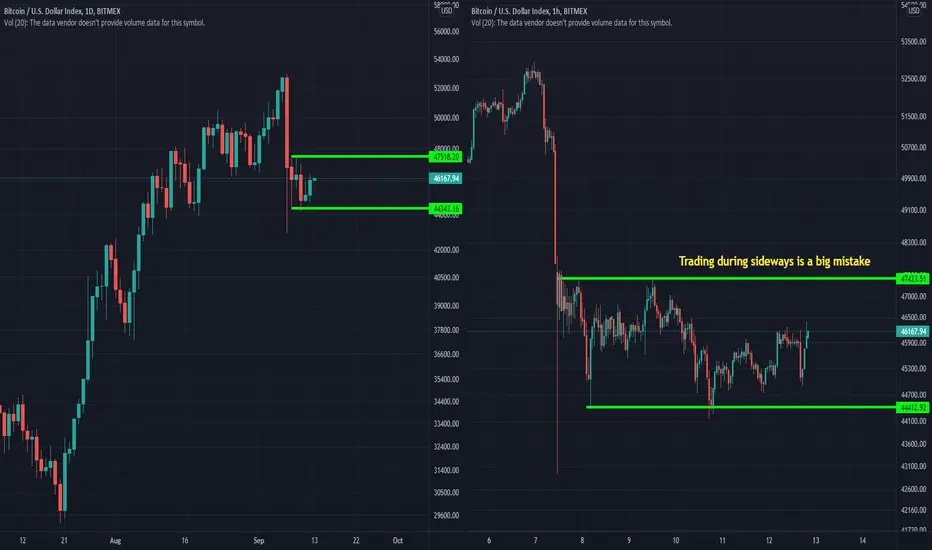
Is it wise to trade bitcoin or Ethereum at these levels?As you see in the charts after the flash crash bitcoin has entered a sideways price pattern.
closing below the lower half in the past five days shows a lack of steam to move higher.
At this point, trading bitcoin is not recommended! waiting for a trend to form is the best approach in my view.
The same story is true for ETH
DISCLAIMER
I’m not a certified financial planner/advisor nor a certified financial analyst nor an economist nor a CPA nor an accountant nor a lawyer. I’m not a finance professional through formal education. The contents on this site are for informational purposes only and do not constitute financial, accounting, or legal advice. I can’t promise that the information shared on my posts is appropriate for you or anyone else. By using this site, you agree to hold me harmless from any ramifications, financial or otherwise, that occur to you as a result of acting on information found on this site.
Use every data point you have at your disposalPeople were wondering how I knew to open short at $52,900.
Some of my previous charts highlighted that as the top profit-taking target during the last leg upward, for instance it was confluent with the .618 extension zone from the Sep 3rd swing low to high.
I also look at things like bearish volume divergence, which was prominent even on the high time frames.
One sort of unorthodox signal I use as well is BTCUSDSHORTS. This goes off of the theory that the market must have participants in both directions, and if it gets too short-heavy or long-heavy then a strong deleveraging sequence is usually right around the corner.
As you can see, on Sep 7th we bottomed out below monthly support at 850. I had already closed my long and had my limit short order ready by that point, but once I saw us falling underneath the purple line to almost the record low on shorts, that was yet another signal to me that this market was overbought and about to create the next swing high on the macro level.

Should you trade inside bars?What Are Inside Days?
Inside days refer to a candlestick pattern that forms after security has experienced daily price ranges within the previous day's high-low range. That is, the price of the security has traded "inside" the upper and lower bounds of the previous trading session. It may also be known as "inside bars." Inside days may indicate consolidation or lower price volatility.
Inside days can be indicative of indecision in the market for security, showing little price movement relative to the previous trading days.
Trading with technical tools like candlesticks is a highly specialized practice and therefore, must be done carefully. Spotting inside days is of interest to a trader because he may believe that the subject security is setting up for some sort of move up or down.
As you see in the chart after Flash crashes in Bitcoin it is quite common to have inside bars!
I believe in consolidation patterns (sideways) I would be better not to trade! because in this situation market becomes efficient and predicting prices movements become harder!
Reference Article:
www.investopedia.com

please share your thumb up - reputationHello guys can't wait to join you on chat to share experience, learn every day and especially tell a lot of bullsh....t
are bulls people saying bullsh...t?
Please 2 seconds for a thumbs up. thank you

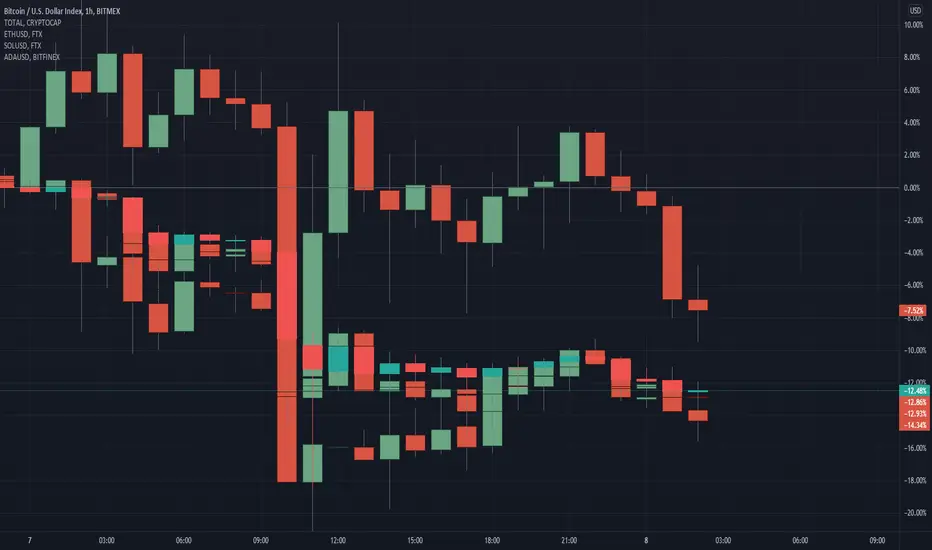
Liquidity Cascade, Whale Effect or a bigger Scheme???In this 5 minute chart, you can see CRYPTOCAP:TOTAL BITMEX:XBT CURRENCYCOM:ETHUSD FTX:SOLUSD KRAKEN:ADAUSD .
This level of coordination couldn't be Liquidity Cascade or Whale Effect.
What is it? I could not find an evidence base reason for it but this phenomenon is so big and fast that could not be Algorithmic trading of institutions or retail traders or what so ever..!
I checked the 1-minute chart as well :
It seems there is a superpower that overrules all other players..!
I am 100% sure this is not the last time this phenomenon happens and it will be repeated again very soon, in less than 100 days..!
3rd Flash Crash in the past 6 monthsA flash crash is a very rapid, deep, and volatile fall in prices occurring within a very short time period.
What are the Red Flags in Bitcoin Chart?
1- Bitcoin lost more than 15% of its value in 2 hours..!
2- 30 days gain washed out in a couple of hours..!
3- January 2021, Bitcoin was 30-33 K, and 72% of the total cryptocurrency market cap belong to Bitcoin at that time. Today it is decreased to 42%.
4- Bitcoin Experienced weakness in the past 3 months rebound in comparison to total cryptocurrency market cap.
5- When flash crashes like this tends to repeat frequently, it puts a very big question mark in front of investors and those who think long-term.
6- It seems people are searching for the next bitcoin and retail traders tend to invest and trad Altcoin much more.
In conclusion, If you are a trader cryptocurrency market offers lots of opportunities because of the high volatility.
but the question:
Are you ready to handle this level of volatility???
Moshkelgosha
DISCLAIMER
I’m not a certified financial planner/advisor nor a certified financial analyst nor an economist nor a CPA nor an accountant nor a lawyer. I’m not a finance professional through formal education. The contents on this site are for informational purposes only and do not constitute financial, accounting, or legal advice. I can’t promise that the information shared on my posts is appropriate for you or anyone else. By using this site, you agree to hold me harmless from any ramifications, financial or otherwise, that occur to you as a result of acting on information found on this site.

BTC 15m Elliott wave countBy Elliott wave count indicator we can see wave a is impulse so we can expecting zigzag correction to previous wave 4 of last impulse on daily chart
Bitcoin or Altcoins?April 2020 - April 2021 :
Total outperform Bitcoin by 27%
April 2021 - September 2021:
The gap is still 27%
Now let's look at Total 2 and compare it with Bitcoin:
April 2020 - April 2021 :
Total outperform Bitcoin by 660%
April 2021 - September 2021:
The gap is 60%
This comparison clearly shows people tend to invest and trade altcoins..! while Total2 is approaching its all-time high, bitcoin is 25% below its All-time high..!
The story for Ethereum is different!
DISCLAIMER
I’m not a certified financial planner/advisor nor a certified financial analyst nor an economist nor a CPA nor an accountant nor a lawyer. I’m not a finance professional through formal education. The contents on this site are for informational purposes only and do not constitute financial, accounting, or legal advice. I can’t promise that the information shared on my posts is appropriate for you or anyone else. By using this site, you agree to hold me harmless from any ramifications, financial or otherwise, that occur to you as a result of acting on information found on this site.


Bitcoin runs out of steam once more!It depends on the time frame you are looking for, but it seems correction is more likely than the breaking above the resistance level.
Looking at the weekly and monthly chart makes it more clear!
Weekly:
Monthly:
Pay attention to resistance and support levels, closure below 50EMA will enhance more bearish case!

BTC 1h Elliott wave countPrice try to turn back by impulse but it resistance by trend line than reverse it look like in wave c now

BITCOIN / US DOLLARBitcoin is now at a strong resistance area
We expect it to move in a downside direction targeting 27225
The second target is 19,660 .
