Steal the Breakout: Broadcom Bulls Are In!💎🔓 "Broadcom Break-In: Bullish Vault Raid in Progress!" 🔓💎
🌟Hi! Hola! Ola! Bonjour! Hallo! Marhaba!🌟
Dear Money Makers & Market Robbers 🤑💰✈️,
It’s time for a high-stakes raid on BROADCOM, INC (AVGO) — all based on our secret Thief Trading Strategy™, combining sharp technicals & a sniff of fundamen
Key facts today
Next report date
—
Report period
—
EPS estimate
—
Revenue estimate
—
2.275 CHF
5.09 B CHF
44.56 B CHF
4.61 B
About Broadcom Inc.
Sector
Industry
CEO
Hock E. Tan
Website
Headquarters
Palo Alto
Founded
1961
FIGI
BBG00KKCRDY1
Broadcom Inc. is a global technology company, which designs, develops, and supplies semiconductors and infrastructure software solutions. It operates through the Semiconductor Solutions and Infrastructure Software segments. The Semiconductor Solutions segment refers to product lines and intellectual property licensing. The Infrastructure Software segment relates to mainframe, distributed and cyber security solutions, and the FC SAN business. The company was founded in 1961 and is headquartered in Palo Alto, CA.
Related stocks

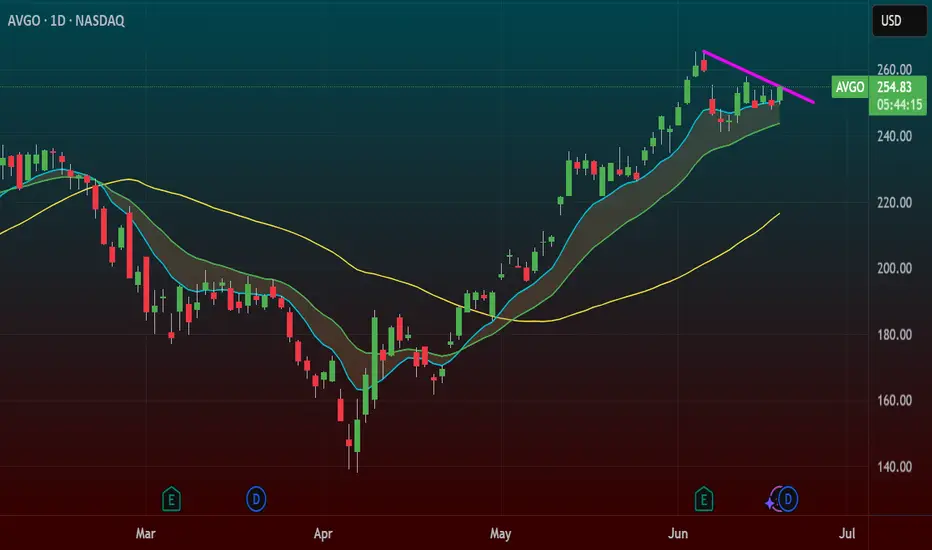
AVGO ( Broadcom.Inc ) NASDAQ:AVGO - Continuation of movement within the ascending channel + potential for a breakout to new historical highs. 🔍 Rationale:
• After a strong correction in the first quarter of 2025, the price formed a reversal and has been moving in a clear ascending channel since the beginning of May.
• T

Broadcom Topped?3 Weeks ago AVGO put in a topping tail candle on the weekly and for the past 3 weeks it has failed to close above the topping tail on a weekly basis. I've also highlighted some bearish divergence on the RSI. The topping tail will remain the dominant candle unless AVGO can close above the high of the

here is the #chart for $AVGOBullish with high expectations. Broadcom ( NASDAQ:AVGO ) is at $269.35, down 0.30% daily but up 11.28% monthly, as shown in the finance card above. X posts and analyst upgrades (HSBC to $400, Bernstein to $295) reflect strong optimism, driven by AI chip demand (projected $28.4B in 2026, $42.8B in 20

Broadcom - This was just the first all time high!Broadcom - NASDAQ:AVGO - just created new highs:
(click chart above to see the in depth analysis👆🏻)
Over the course of the past three months, Broadcom has been rallying an impressive +80%. However looking at market structure, all of the previous "dump and pump" was not unexpected. Following th


$AVGO above its previous ATH and holding on. 400 $ reachable. The poster child of the AI rally has been NASDAQ:NVDA and $AVGO. Here we have analysed both the stocks multiple times fundamentally and technically. But the lesser known NASDAQ:AVGO has performed better than the NASDAQ:NVDA since the April lows. NASDAQ:AVGO is still above its previous ATH an

AVGO – All-Time High Breakout with Flag Pattern TriggerBroadcom ( NASDAQ:AVGO ) is breaking out of an 11-day consolidation flag, pushing through the trendline and into all-time highs — a textbook momentum setup.
🔹 Flag Pattern Breakout
After a strong run, NASDAQ:AVGO spent 11 days chopping in a tight flag just under highs.
Today, we’re seeing a cle
AVGO CRACK!Fun while it lasted.
Even though I like AVGO, a crack is a crack is a crack!
Rising bearish wedge.
Time to take profits.

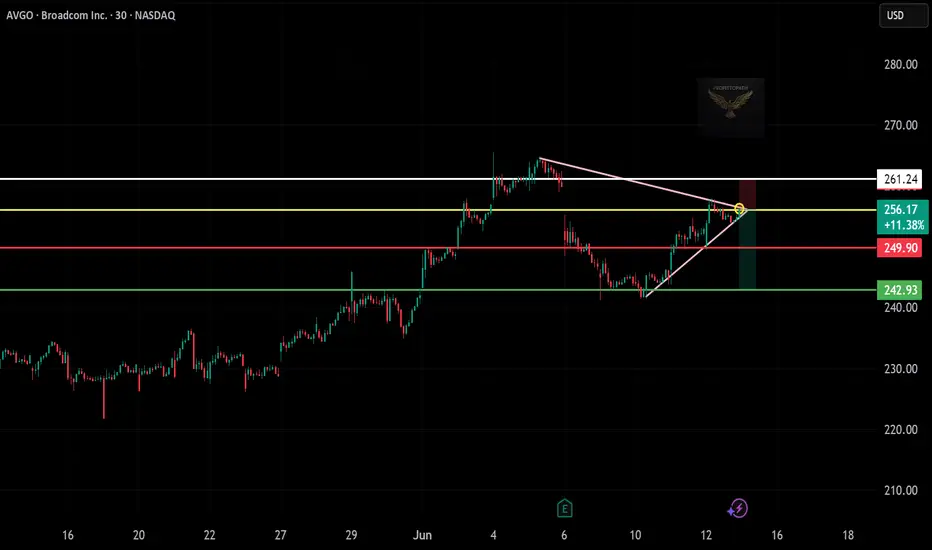
AVGO Short Setup: Rising Wedge Rejection!""
Simple Breakdown:
Pattern: Bearish rising wedge + resistance rejection
Entry: $256.17 (yellow zone rejection)
Stop Loss: $261.24 (wedge top resistance)
Target: $242.93 (previous support zone)
Risk/Reward: Approx. 1:2.6 ✅
See all ideas
Summarizing what the indicators are suggesting.
Neutral
SellBuy
Strong sellStrong buy
Strong sellSellNeutralBuyStrong buy
Neutral
SellBuy
Strong sellStrong buy
Strong sellSellNeutralBuyStrong buy
Neutral
SellBuy
Strong sellStrong buy
Strong sellSellNeutralBuyStrong buy
An aggregate view of professional's ratings.
Neutral
SellBuy
Strong sellStrong buy
Strong sellSellNeutralBuyStrong buy
Neutral
SellBuy
Strong sellStrong buy
Strong sellSellNeutralBuyStrong buy
Neutral
SellBuy
Strong sellStrong buy
Strong sellSellNeutralBuyStrong buy
Displays a symbol's price movements over previous years to identify recurring trends.
Curated watchlists where 1YD is featured.


Frequently Asked Questions
The current price of 1YD is 224.844 CHF — it has increased by 0.51% in the past 24 hours. Watch BROADCOM INC stock price performance more closely on the chart.
Depending on the exchange, the stock ticker may vary. For instance, on BX exchange BROADCOM INC stocks are traded under the ticker 1YD.
1YD stock has fallen by −1.02% compared to the previous week, the month change is a 5.90% rise, over the last year BROADCOM INC has showed a 47.58% increase.
We've gathered analysts' opinions on BROADCOM INC future price: according to them, 1YD price has a max estimate of 318.70 CHF and a min estimate of 167.32 CHF. Watch 1YD chart and read a more detailed BROADCOM INC stock forecast: see what analysts think of BROADCOM INC and suggest that you do with its stocks.
1YD stock is 3.68% volatile and has beta coefficient of 2.39. Track BROADCOM INC stock price on the chart and check out the list of the most volatile stocks — is BROADCOM INC there?
Today BROADCOM INC has the market capitalization of 1.03 T, it has increased by 1.06% over the last week.
Yes, you can track BROADCOM INC financials in yearly and quarterly reports right on TradingView.
BROADCOM INC is going to release the next earnings report on Aug 28, 2025. Keep track of upcoming events with our Earnings Calendar.
1YD earnings for the last quarter are 1.31 CHF per share, whereas the estimation was 1.30 CHF resulting in a 0.69% surprise. The estimated earnings for the next quarter are 1.33 CHF per share. See more details about BROADCOM INC earnings.
BROADCOM INC revenue for the last quarter amounts to 12.42 B CHF, despite the estimated figure of 12.38 B CHF. In the next quarter, revenue is expected to reach 12.65 B CHF.
1YD net income for the last quarter is 4.11 B CHF, while the quarter before that showed 5.02 B CHF of net income which accounts for −18.08% change. Track more BROADCOM INC financial stats to get the full picture.
Yes, 1YD dividends are paid quarterly. The last dividend per share was 0.48 CHF. As of today, Dividend Yield (TTM)% is 0.83%. Tracking BROADCOM INC dividends might help you take more informed decisions.
BROADCOM INC dividend yield was 1.25% in 2024, and payout ratio reached 170.61%. The year before the numbers were 2.19% and 55.79% correspondingly. See high-dividend stocks and find more opportunities for your portfolio.
As of Jul 15, 2025, the company has 37 K employees. See our rating of the largest employees — is BROADCOM INC on this list?
EBITDA measures a company's operating performance, its growth signifies an improvement in the efficiency of a company. BROADCOM INC EBITDA is 25.74 B CHF, and current EBITDA margin is 48.98%. See more stats in BROADCOM INC financial statements.
Like other stocks, 1YD shares are traded on stock exchanges, e.g. Nasdaq, Nyse, Euronext, and the easiest way to buy them is through an online stock broker. To do this, you need to open an account and follow a broker's procedures, then start trading. You can trade BROADCOM INC stock right from TradingView charts — choose your broker and connect to your account.
Investing in stocks requires a comprehensive research: you should carefully study all the available data, e.g. company's financials, related news, and its technical analysis. So BROADCOM INC technincal analysis shows the buy rating today, and its 1 week rating is buy. Since market conditions are prone to changes, it's worth looking a bit further into the future — according to the 1 month rating BROADCOM INC stock shows the neutral signal. See more of BROADCOM INC technicals for a more comprehensive analysis.
If you're still not sure, try looking for inspiration in our curated watchlists.
If you're still not sure, try looking for inspiration in our curated watchlists.