AVGO TO HUNG IT SELF CAP"(What goes up must come down some how)"
Will let see it for real
But we must watch the red leves (targets and support) and when the correction start we also must consider the 0.5 and 0.618 retracment
As always wish me luck
Good luck to me 😁
Please not financial advice
1YD trade ideas

AVGO peak scanning strategyStrategy to scan AVGO peak first, take profits and collect low prices.
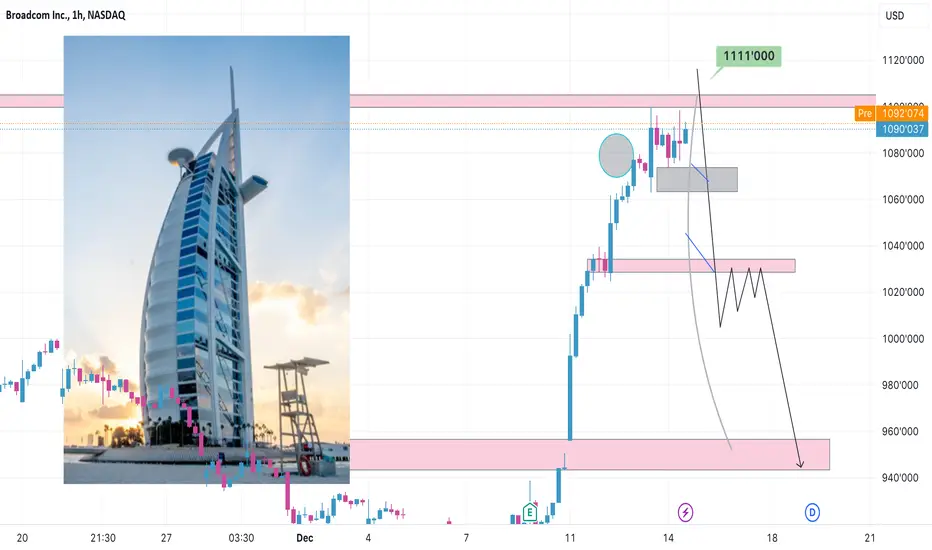
After the financial report of avgo stock, the stock value increased to the highest ever from 911 to 1099, I predict that AVGO will have a scenario of sweeping the top to create a target price of 200, from 911 to 1111, then down back to the starting place
AVGO: Eyeing an aggressive bullish breakout. Broadcom Inc is overbought on the 1D technical outlook (RSI = 75.003, MACD = 23.960, ADX = 31.411) but on the long term it is only testing the middle of the 1 year Channel Up pattern. This recent rally was initiated after the 1D MA50 held on December 6th. If the middle of the Channel Up breaks, we will go long and target the top (TP = 1,300) as it could be a bullish breakout as aggressive as May 26th. If it doesn't break, we will wait for another pullback to the 1D MA50 and then buy towards the middle again (TP = 1,100).
See how our prior idea has worked:
## If you like our free content follow our profile to get more daily ideas. ##
## Comments and likes are greatly appreciated. ##

Breaking a trendlineWe see a 50% retracement of the impulse. If the trend line is broken, we look for opportunities to open a LONG position.

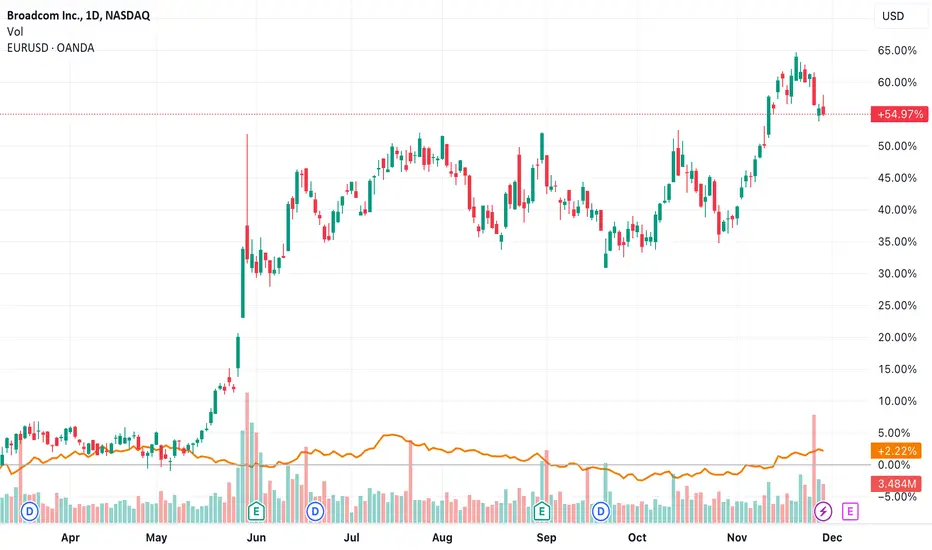
Broadcom Ltd (NASDAQ: $AVGO) Growth MomentumPrice Momentum
AVGO is trading near the top of its 52-week range and above its 200-day simple moving average.
The 50-day Moving Average is above the 200-day moving average meaning NASDAQ:AVGO may continue its Bullish Trend.
NASDAQ:AVGO 's 50-day moving Average crosses the 100-day Moving Average indicating a partial "Golden Cross".
Investors have been pushing the share price higher, NASDAQ:AVGO still appears to have upward momentum. This is a positive sign for $AVGO.

SPX & Feds Balance SheetThe feds Balance sheet reduced from $7.96 Trillion to $7.73 Trillion
This is the largest reduction in the balance sheet since September 1st 2023.

Broadcom at a crossroads below a key resistanceShares in Broadcom Inc (symbol ‘AVGO’) have moved up so far this month with higher momentum to reach an all-time high of $999.50 on 20 November. The focus on AI has been very positive for this share, with the price having gained around 80% since the beginning of the year.
Broadcom’s earnings report for the financial quarter ending in October is expected on Thursday 7 December after hours. The consensus for EPS is $9.71, with the 11 estimates ranging from $9.49 to $9.93. There is currently no indication that the actual dividend of $4.60 will change from last quarter.
‘Broadcom has been one of the relatively less “manic” tech shares during the current AI rush,’ said Michael Stark, an analyst at Exness, ‘That’s partially to do with the price of the share; at nearly $1,000, this looks quite steep for many participants. However, with an estimated PE of about 25 for this year, AVGO is close to fair value by this measure compared to the Nasdaq’s average of about 24.50.’
$1,000 is a critical resistance which might be difficult to break through in the near future unless there’s a significant positive surprise from the upcoming earnings report. Based on TA, it might seem more likely for the price to consolidate or retrace lower and buyers to return when the overbought signal disappears, possibly around $925 or maybe as low as $880. An immediate attempt to push above $1,000 after earnings could be a fakeout: it might be instructive to compare Nvidia’s performance after its latest earnings.
Broadcom Closes $69 Billion VMware Deal After China ApprovalBroadcom (AVGO.O) closed its $69 billion acquisition of cloud-computing firm VMware (VMW.N) after receiving regulatory approval in last major market China and ending a months-long saga.
The deal, one of the biggest globally when announced in May 2022, was the latest in CEO Hock Tan's efforts to boost the chipmaker's software business.
However, the transaction faced tough regulatory scrutiny across the world and the companies had delayed the closing date three times.
China's regulatory approval came through on Tuesday after ongoing tensions with the U.S. around tougher chip export control measures had stoked fears among some investors on the company's ability to close the deal before the Nov. 26 deadline.
"The improved mood music after the meeting between China's President Xi Jinping and U.S. President Joe Biden earlier this month helped to settle remaining nerves," Danni Hewson, head of financial analysis at AJ Bell, said on Tuesday, after the companies said they planned to close the transaction on Nov. 22.
The European Commission had approved the acquisition after Broadcom offered remedies to help rival Marvell Technology (MRVL.O) while the UK's Competition and Markets Authority (CMA) gave its green light following an in-depth investigation.
Big Tech mergers such as Microsoft's (MSFT.O) now-closed $69 billion purchase of the "Call of Duty" publisher Activision have faced heightened regulatory pressure from the U.S. Federal Trade Commission under its Chair Lina Khan.
Price Momentum
AVGO is trading near the top of its 52-week range and above its 200-day simple moving average.
What does this mean?
Investors have been pushing the share price higher, and the stock still appears to have upward momentum. This is a positive sign for the stock's future value.

Markets Hitting FOMOThe major indices have outperformed over the last couple weeks.
Shorts and put skews are at all time lows.
No downside protection is being bought at this time.
Are stocks going to the moon again?

$AVGO Broadcom Inc. Bull FlagA pull back to the orange line will be my buying opportunity, break below and confirm stop out. The mention of a "Bull Flag breakout" in relation to NASDAQ:AVGO (Broadcom Inc.) suggests a specific pattern in technical analysis that indicates potential bullish momentum. Here's a breakdown of what this means:
1. **Bull Flag Pattern**: This is a continuation pattern that occurs after a strong price movement upwards, followed by a consolidation phase that forms the 'flag.' The flag is typically a slight downward or horizontal sloping rectangle formed by parallel trendlines against the preceding uptrend. This pattern is considered bullish because it often signals that the stock is gathering strength before a further upward move.
2. **Breakout**: A breakout in this context means that the stock price has moved above the upper boundary of the flag pattern. This is usually accompanied by an increase in volume and is seen as a confirmation that the stock is resuming its prior uptrend.
3. **Implications for NASDAQ:AVGO **: For Broadcom Inc., the observation of a Bull Flag breakout implies that the stock might be entering a phase of continued upward price movement. Investors and traders often interpret this as a buying opportunity, anticipating further price increases.
4. **Technical Analysis Considerations**: When analyzing a Bull Flag breakout, it's important to consider the volume during the breakout (higher volume provides stronger confirmation), the height of the mast (the initial price surge before the flag formation), and whether other technical indicators support the bullish sentiment.
5. **Risk Management**: While Bull Flag breakouts can be powerful signals, they are not infallible. It’s crucial to incorporate risk management strategies, such as setting stop-loss orders, to protect against the possibility that the breakout does not lead to the expected upward trend.
6. **Fundamental Factors**: Beyond technical analysis, it's also essential to consider Broadcom's fundamental factors, such as its financial health, industry trends, and overall market conditions, as these can impact the stock's performance irrespective of technical patterns.
Remember, technical analysis like the Bull Flag pattern is just one tool in a broader investment strategy. It's always recommended to consider a range of factors and perform comprehensive analysis before making investment decisions.

AVGO - 5 months ASCENDING TRIANGLE══════════════════════════════
Since 2014, my markets approach is to spot
trading opportunities based solely on the
development of
CLASSICAL CHART PATTERNS
🤝Let’s learn and grow together 🤝
══════════════════════════════
Hello Traders ✌
After a careful consideration I came to the conclusion that:
- it is crucial to be quick in alerting you with all the opportunities I spot and often I don't post a good pattern because I don't have the opportunity to write down a proper didactical comment;
- since my parameters to identify a Classical Pattern and its scenario are very well defined, many of my comments were and would be redundant;
- the information that I think is important is very simple and can easily be understood just by looking at charts;
For these reasons and hoping to give you a better help, I decided to write comments only when something very specific or interesting shows up, otherwise all the information is shown on the chart.
Thank you all for your support
🔎🔎🔎 ALWAYS REMEMBER
"A pattern IS NOT a Pattern until the breakout is completed. Before that moment it is just a bunch of colorful candlesticks on a chart of your watchlist"
═════════════════════════════
⚠ DISCLAIMER ⚠
The content is The Art Of Charting's personal opinion and it is posted purely for educational purpose and therefore it must not be taken as a direct or indirect investing recommendations or advices. Any action taken upon these information is at your own risk.

Broadcom Inc. (AVGO) Market Analysis & Growth ForecastProduct and Market Overview:
Broadcom offers semiconductor devices with applications across various industries.
Headquartered in San Jose, California, specializing in mixed signal and analog III-V based products.
Financial Performance and Growth (2018-2022):
Revenue Growth: Consistent increase from $20.8 billion (2018) to $33.2 billion (2022).
Net Income: Marked growth with $11.2 billion in 2022.
Earnings Per Share: Improved from $12.66 in 2018 to $27.06 in 2022.
Cash Flow Insights:
Strong growth in net cash from operating activities.
Significant investments in 2019 and 2020.
Financing activities vary, impacting overall cash reserves.
Market Performance and Outlook:
Stock price as of Nov 10, 2023: $957.52.
Q3 Earnings exceeded expectations at $10.54 per share.
Anticipated Q4 EPS: $11.00.
Strong valuation ratios and operating margins indicate robust profitability.
Competitive Positioning:
Against Intel Corporation (INTC), MACOM Technology Solutions (MTSI), NXP Semiconductors (NXPI), and Qorvo Inc. (QRVO): Broadcom stands out due to its product range and application scope.
Conclusion:
Broadcom's financial statements, market performance, and strategic positioning against key competitors underscore its status as a robust and growing force in the semiconductor sector.

AVGOQuietly attempting a breakout of this rectangle today. Looking for ~$1,020 next then $1,350s sometime next year if this breakout holds. Long & looking to add if RSI closes above 70 today.

AVGO ready to GO Broadcom is challenging the upper boundary of a well-defined rectangle. Rectangles narrower than 15% of the underlying value of the asset is my absolute favorite pattern.

Broadcom (AVGO) - Just an ideaWhile lagging indicators are cooling off (RSI/MACD on Weekly) it remains to be proven if AVGO makes it further up or swing failures the highs.
Overall, I am looking to take a short from the upper zone if given.
Could she dump from right where she is? In theory yes, but in that case my count(s) are wrong.

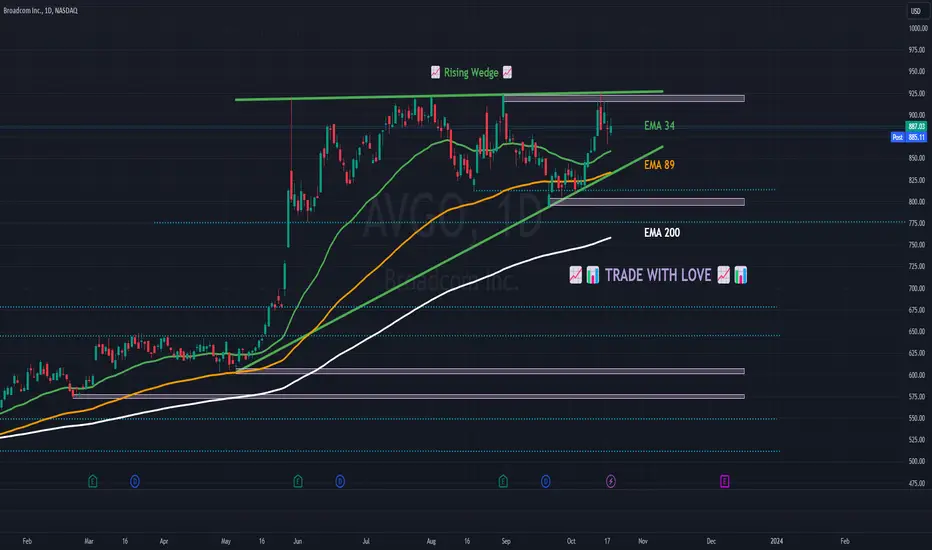
📈📊 #ChartPattern Alert! 📈📊 📈 Rising Wedge 📈📈 What is a Rising Wedge? The Rising Wedge is a bearish chart pattern characterized by two converging trendlines, with the lower trendline sloping upward more than the upper trendline. It typically signals a potential bearish reversal, with the price likely to break downward after the wedge pattern.
📈 How to Identify:
Draw a trendline connecting at least two lower highs (upper trendline).
Draw another trendline connecting at least two lower lows (lower trendline).
📈 What it Signals: The Rising Wedge suggests a potential bearish reversal, with sellers prevailing at lower highs within the wedge. It often forms during uptrends and can precede a significant price move to the downside.
📈 Trade Strategy:
Consider short-selling or setting stop-loss levels if the price breaks below the lower trendline of the Rising Wedge.
Set profit targets based on the pattern's height subtracted from the breakdown point.
Implement a stop-loss to manage risk in case of a false breakdown.
Remember to use other technical indicators and conduct thorough research to support your analysis before making any trading decisions. Happy charting and trading! 📉💹
See Broadcom over $1000 by EOYUsing TA that includes Elliot waves and fibs... I believe Broadcom will finish the year strong over $1000.

BROADCOM Straightforward plan with an eye on the break out.AVGO is testing the Resistance (1) level (925) of the 4 month Rectangle pattern.
This is a short term sell signal unless it crosses upwards.
The Rising Support trend line has been holding the long term bullish trend intact for 1 year exactly (October 13th 2022).
Trading Plan:
1. Sell as long as the candles close under Resistance (1).
2. Buy if one closes over it.
Targets:
1. 840 (Rising Support).
2. 1077 (Fibonacci 2.0 extension).
Tips:
1. The RSI (1d) crossed above its Rising Resistance. Potential signal, in combination with holding the Rising Support, that a long term break out is ahead.
Please like, follow and comment!!

AVGO long positionAVGO looks interesting.
Let´s enter a long position and wait for the price to achieve the target.
Our predicted target is 921.73 $
Stop loss and target lines are indicated on the chart.
Good luck!

ASCENDING TRIANGLETop line virtually flat with a resistance line that has been tested x 4.
Each touch of a support or resistance line strengthens the level.
Neutral pattern until broken.
No recommendation.
"Even if you are on the right track, you will get run over if you just sit there."
Will Rogers

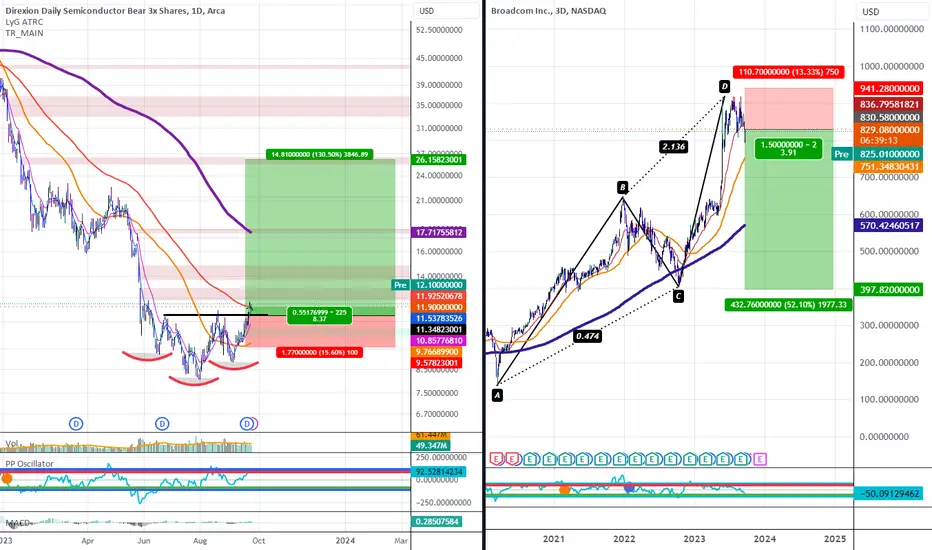
AVGO and SOXS Preparing to Move BigSOXS the 3x Inverse ETF for Semiconductors, has broken out of a Bullish Head and Shoulders and now sits at the 89EMA. If things go as expected, SOXS should be clear to at least give us a 60-150% rally. At the same time, we also have a Bearish AB=CD on AVGO and what looks to simply be filling of a gap it made at $830 after breaking below its own slanted Bearish Head and Shoulders neckline as seen here:
If things go as I expect them to, we will see AVGO open the week to aggressive downside with minimum overall targets as deep as 50% below current prices.
Bearish Alert : AVGOBearish Alert, with attempt of negative price action and bearish crossover of EMA 21/50
The last crossover moved the price up by 90%

AVGO - gaps down on rumor of Google changing suppliersNASDAQ:AVGO had a volatile premarket and a gap down on open on the news of NASDAQ:GOOG cutting them as a supplier.
www.reuters.com
This kind of news pops up for chip suppliers and rarely amounts to much.
The gap down closed the small gap from 8/21. If we take a measured moves of the gap from the most recent highs we could see price move in a new range that comes down to ~765, or even ~720. The 720 range would fill the gap from May.
I anchored a VWAP to the March 13 candle. This candle was the first test of the March gap up and established the consolidation range that took place for the next two months. This VWAP coincided with the low during the premarket selloff. It will be important for this level to hold as support otherwise we could see a test of the VWAP from the November 2022 gap up or the VWAP from the end of the October drawdown. Note that each of these are displaying confluence with the 200SMA and the bottom of the larger measured range down. All of which are below the opening of the May gap.
My game plan from Aug 8 remains in place.
My first buy orders target hit during pre-market and my remaining at ~750 and ~730 are still in place.
