$92~$96 zone is the key level!in weekly time frame, the next destination of paypal stock is $92~$96.
after that:
- if the market unwell, we might see $65.
- if the market well, we might see $112 or $136.
so be caution at this level.
2PP trade ideas

PYPL: Can Hedgie change fortunes?PayPal
Short Term - We look to Buy at 78.86 (stop at 71.88)
Activist hedge fund Elliot Management reported to have increased stake. Price jumped 6% in premarket. Although the bears are in control, the stalling negative momentum indicates a turnaround is possible. There is scope for mild selling at the open but losses should be limited. We look to buy dips. Further upside is expected.
Our profit targets will be 99.79 and 104.00
Resistance: 100.00 / 123.00 / 154.00
Support: 75.00 / 60.00 / 40.00
Please be advised that the information presented on TradingView is provided to Vantage (‘Vantage Global Limited’, ‘we’) by a third-party provider (‘Signal Centre’). Please be reminded that you are solely responsible for the trading decisions on your account. There is a very high degree of risk involved in trading. Any information and/or content is intended entirely for research, educational and informational purposes only and does not constitute investment or consultation advice or investment strategy. The information is not tailored to the investment needs of any specific person and therefore does not involve a consideration of any of the investment objectives, financial situation or needs of any viewer that may receive it. Kindly also note that past performance is not a reliable indicator of future results. Actual results may differ materially from those anticipated in forward-looking or past performance statements. We assume no liability as to the accuracy or completeness of any of the information and/or content provided herein and the Company cannot be held responsible for any omission, mistake nor for any loss or damage including without limitation to any loss of profit which may arise from reliance on any information supplied by Signal Centre.

PYPL setup for a SHORTI've indicated:
my ideal area of where I'd like to short PYPL.
my ideal area of where I'd like to place my stop loss.
my ideal area of where I'd like to place my target.
Notes:
As long as the price action continues to settle below the black channel on a weekly basis and does not overcome the teal descending structure - this setup has merit.
If at anytime those structures are settled above, this would be considered a failed breakout.


SELLPayPal is still under bearish pressure.
By the volume zone (point of control), we can identify who controls the market - bulls or bears and analyze the point of support and resistance.
In March 2020, the high volume zone acts as strong support and the bulls made a bull run with gains of 257%.
Since then, the sellers have jumped into the game and broke the volume zone at 185 that was previous support and now turn resistance (formed as bear flag).
Another volume zone that broke by the bears is at 105 which is now resistance point.
The last breakout of the volume zone is a very high volume area with many bears that are going to defend their positions so I suspect we are going to see the bearish triangle break to POC at 45.


PYPL DAILY WOLFE WAVE SETUPThere is a daily wolfe wave setup. The projected target is calculated by extending a linear line between pivot 1 and 4 and projecting the line. This is represented as the green perforated line, as shown in the chart. The projected target is 84 which is expected to reach this price target anytime before earnings. There is also a gap that remains open. If markets trades green, the next few days, then PYPL may experience short term momentum that would attempt a gap fill at 84 before earnings. Stop loss consideration would be at 67.00.


PYPL possible pullback into larger bounceI'm currently watching PYPL as a possible swing long on a potential pullback into the end of the week to benefit from a potential market bounce that I've been anticipating into the end of July- I think this name provides uniquely beneficial risk: reward potential for a bounce play; I think we are repeating patterns across the board that we made in the lead-up to the march fakeout Rally- made a rectangle around where I suspect we are in said lead-up. Not everything will be 1 for 1, of course, but my convictions through July are that we go higher before the market eventually makes the next leg lower. I think a reasonable price target for said play would be the high 80's. Best of luck all!

PYPL Buy OpportunityIf you haven`t sold PYPL ahead of earnings:
As much i as i don`t like to work with PayPal on my store due to their high commission fees, i like the October 2017 level of the stock on a P/E of 23.60.
I`m looking for a technical rebound to the $88 resistance.
Looking forward to read your opinion about it.


PYPL - Time To AccumulateAlthough I have said PYPL may get down to the 50s a big bounce is coming and NDX has been hanging around a while and also printing bearish RSI divergence.
So considering that indexes often move pre-market and stocks can gap up for the start of a bounce, I've decided I will begin buying this area and down to $50 if it gets there.
Not advice.

PYPL - Is there a stock market in Hell?Is PYPL about to find the lowest point in Hell before ascending into Purgatory? I'm not sure how the Purgatory thing works....
This is not a buy recommendation unless you like to suffer the ravages of eternal damnation. If you like that sort of thing buy this stock today.
I'm going to take a wait and see approach to see if it touches the lower channel line.... Maybe hitch a ride at that point to ascend into Purgatory.


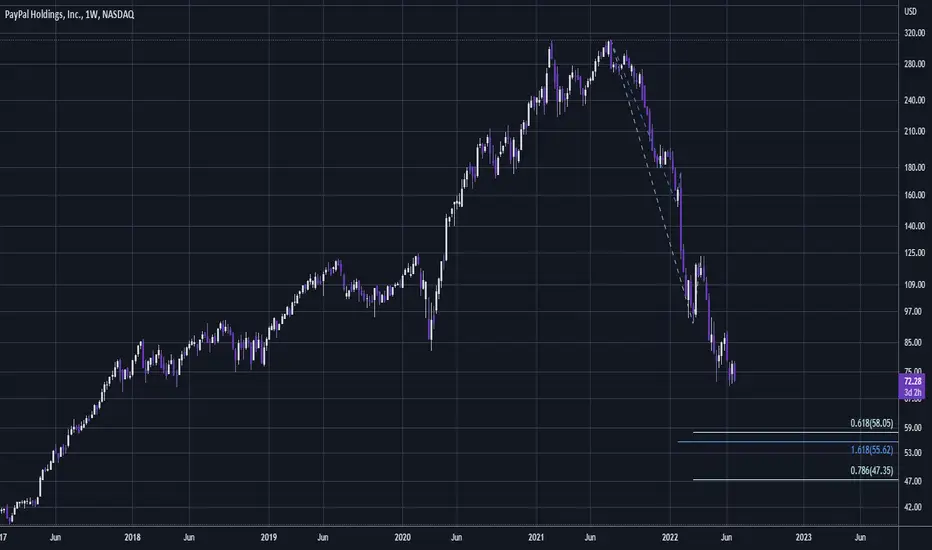
PYPL - $55 Target On The CardsIt looks like my long term target from back in February of $55 may be on with some overshoot could perhaps go sub $50 ,maybe $47 but not much further than that I think.
Apologies to anyone that followed my previous thread with the back and forth of indexes I did forget to update the thread.
Anyhow with NDX turning bearish again but with bullish weekly RSI divergence I'm now looking to PYPL as a buy for a BIG bounce again.
So somewhere within the drawn fib cluster I think.
Not advice.
PYPL - Charts That Make You Go Hmm 🤔PYPL appears to be base jumping here in complete free fall since the 200WMA fakeout. This is a new trend so RSI readings can be deceiving and is currently a razor sharp falling knife.
The acceleration suggests the next bounce or bottom is still a way off. It will probably get to the 0.618 @ $73 at least but with a little more patience and less FOMO I think it will see $55.
Not advice.
