3HM trade ideas
MSCIan upward trend in the prices of an industry's stocks or the overall rise in broad market indices, characterized by high investor confidence

MSCI Inc. (MSCI) - Head & Shoulders Breakdown📉 Short Setup
🔍 Description:
MSCI Inc. (NYSE: MSCI) has formed a Head & Shoulders pattern, a bearish reversal setup. The price has broken below the neckline, confirming downside momentum. A retest of the neckline could provide another short entry opportunity.
📊 Trade Details:
🔹 Entry: Below neckline breakdown confirmation
🔴 Stop Loss: 607.87
🟢 Target: 490.44
📌 Confirmation:
A breakdown with strong volume adds conviction to the move. If price reclaims the neckline and holds above, the bearish setup could be invalidated.
Trade wisely! 📉🚨

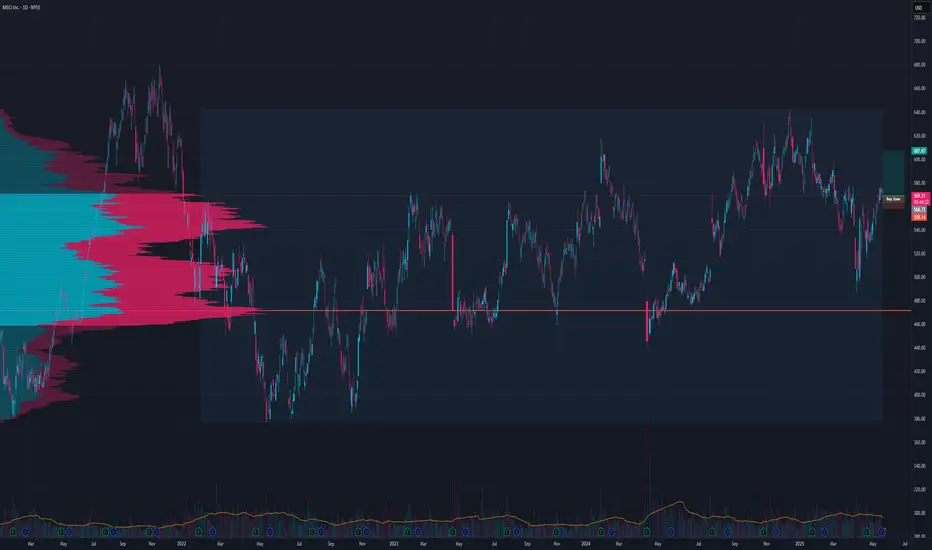
MSCI short thesisI think since the run topped in 2021, we are stuck in a sideways correction.
In my opinion, the chart did bulid out a larger wave-a to the downside in '22. Since the low, price started surging again, but im declaring these gains as a corrective move towards a lager wave-b.
Im calling out a short target in the upper blue box. Price should reverse in this area and slowly start falling towards the pink SMMA-line.

MSCI - awaiting for bullish signalTime and again the market has a way to play out the traders, they knew how you draw your charts and thus the manipulators or smart money will often went below the stop loss level to take you out and days or weeks later, push the price up again.
Let's see how it goes in a week or two time.

Unlocking Profit Potential with MSCI Inc. (NYSE: MSCI)Unlocking Profit Potential with MSCI Inc. (NYSE: MSCI)
Today, I bring forth an opportunity that's been making waves in the financial world: MSCI Inc. (NYSE: MSCI). As an expert in market analysis, I strongly recommend considering due diligence in this global leader in data and software services for asset managers. Here's why MSCI is catching my eye:
MSCI boasts a remarkable 96% of revenue from recurring sources, thanks to its long-term contracts with esteemed clients in the asset management sphere. This translates to consistent and reliable streams of income and profits, providing a solid foundation for investors seeking stability in their portfolios.
The company operates across three main segments: Index, Analytics, and ESG & Climate. While each segment plays a crucial role, the Index division stands out as MSCI's crown jewel. Generating 60% of revenue and 70% of operating profit, with operating margins in the mid-70% range, the Index segment underscores MSCI's dominance in global equity indexes.
MSCI's prowess in constructing indexes based on market cap, factor, fixed income, and thematic criteria is unmatched. With over $15 trillion in assets under management benchmarked to its equity indexes and more than 1,300 ETFs tracking its benchmarks, MSCI holds a formidable position in the market.
Under the guidance of Chairman and CEO Henry Fernandez, MSCI has experienced exceptional growth since 1998. Revenue has surged from $370 million to $2.5 billion, and earnings per share have skyrocketed from around $1 to over $13. This growth trajectory has propelled MSCI's stock price, outperforming the S&P 500 index by more than 6X since going public in 2007.
Despite its stellar performance, MSCI presents a rare opportunity for investors to enter at an attractive valuation. With dividends rising annually since 2017 and significant share repurchases, MSCI is committed to delivering value to its shareholders.
Consider this your call to action: Perform due diligence on MSCI Inc. (NYSE: MSCI) to capitalize on its promising prospects and potential for growth. Don't miss out on this opportunity to position yourself for success in the ever-evolving world of finance.
Seize the moment and unlock potential profits with MSCI.
Happy Trading,
Speciale Analysis

MSCI Holds Earnings BreakoutMSCI rallied on strong earnings last month, and some investors may look for the gains to continue.
The first pattern on today’s chart is the bullish price gap on January 30 after profit and revenue beat estimates. The move established prices above the December 29 peak, which was the stock’s highest level since early 2022.
Second, the index provider has held the breakout by remaining above its January 30 low. That may reflect a paucity of sellers.
Third, notice how faster simple moving averages (SMAs) have lined up above the slower SMAs. The teal 20-day SMA is above the red 50-day SMA. Both are above the gray 100-day SMA, which is also above the green 200-day SMA. That may reflect bullish trends.
Finally, MACD is rising.
TradeStation has, for decades, advanced the trading industry, providing access to stocks, options and futures. See our Overview for more.
Important Information
Past performance, whether actual or indicated by historical tests of strategies, is no guarantee of future performance or success. There is a possibility that you may sustain a loss equal to or greater than your entire investment regardless of which asset class you trade (equities, options, futures or cryptocurrencies); therefore, you should not invest or risk money that you cannot afford to lose. Online trading is not suitable for all investors. View the document titled Characteristics and Risks of Standardized Options at www.TradeStation.com . Before trading any asset class, customers must read the relevant risk disclosure statements on www.TradeStation.com . System access and trade placement and execution may be delayed or fail due to market volatility and volume, quote delays, system and software errors, Internet traffic, outages and other factors.
Securities and futures trading is offered to self-directed customers by TradeStation Securities, Inc., a broker-dealer registered with the Securities and Exchange Commission (“SEC”) and a futures commission merchant licensed with the Commodity Futures Trading Commission (“CFTC”). TradeStation Securities is a member of the Financial Industry Regulatory Authority, the National Futures Association (“NFA”), and a number of exchanges. TradeStation Crypto, Inc. offers to self-directed investors and traders cryptocurrency brokerage services under federal and state money services business/money-transmitter and similar registrations and licenses.
TradeStation Securities, Inc., TradeStation Crypto, Inc., and TradeStation Technologies, Inc. are each wholly owned subsidiaries of TradeStation Group, Inc., all operating, and providing products and services, under the TradeStation brand and trademark. TradeStation Crypto, Inc. offers to self-directed investors and traders cryptocurrency brokerage services. It is neither licensed with the SEC or the CFTC nor is it a member of NFA. When applying for, or purchasing, accounts, subscriptions, products and services, it is important that you know which company you will be dealing with. Visit www.TradeStation.com for further important information explaining what this means.

MSCI.... A Sheep in Wolfe's (Waves) Clothing ???I am seeing a Wolfe Wave formation, breaking today. The target is in early March to around the $530 level. That would be an approximate 1/3 drop of MSCI's runup since late October.
Note this is a 65-minute chart view. MSCI's current beta is 1.13
Insert #1 is the last Wolfe Wave in late 2022, with favorable results. Insert #2 is the current WW where W5 has been recalculated, based on a recent January 30 earnings surprise and MSCI shares gained nearly 17% to today's high. Additionally I have added a cycle analysis which has had a good recent record of projecting tops and bottoms.
As Momentum (RSI) rolls over, one should consider collapsing a current position or shorting.
Let the price action and broad markets direction dictate your position. Don't front run your view
If the markets continue to regurgitate today's Fed comments in a negative way (that is to say, CPI is sticky and rate cuts are put off), then MSCI could weaken considerably.
Not investment advice...do your own due diligence.
Good Luck !
MSCI is an acronym for Morgan Stanley Capital International. It is an investment research firm that provides stock indexes, portfolio risk and performance analytics, and governance tools to institutional investors and hedge funds. It operates through the following segments: Index, Analytics, ESG and Climate, and All Other-Private Assets.
S

$MSCI with a Bullish outlook following its earnings #Stocks The PEAD projected a bullish outlook for $MSCI after a positive under reaction following its earnings release placing the stock in drift A with an expected accuracy of 62.5%.

$MSCI with a Bullish outlook following its earnings #Stocks The PEAD projected a Bullish outlook for $MSCI after a Negative over reaction following its earnings release placing the stock in drift C with an expected accuracy of 55.56%.


MCSI looks so obviousThe MSCI All Country World Index (ACWI) is a stock index designed to track broad global equity-market performance.
Sometimes its better to just sit back and wait.

MSCIThe RSI is near zero on the daily timeframe. On a weekly basis, you can see the reaction from ema100 and large hidden divergences. With a risk, you can take a long one.

MSCI - Daily Global IndexLooking like it's been run over and left for dead along with the NYSE COMP.
Nothing Bullish here and no signs of any Bid anywhere.
It may well reject anything the Raven spouts off about this
week as Central Banks Globally are in the sweet spot of their
Long Con.
__________________________________________________________________
The United States is quietly becoming the fungus without its Citizen Consumers
so much as concerned.
Dollar Senioraage will be a tough habit to break.
MSCI - Daily Global Index
The MSCI World Index captures large and mid-cap representation across 23 Developed Markets Countries
with 1,546 constituent components.
NSCI approximates 85% of the free float-adjusted market capitalization in each country.
____________________________________________________________________________________________
And looking rather grim as the contagion expands.
Global Central Banks began contracting Liquidity - the result in the Chart above.
Never buy when this occurs.
It assures you of losses every time throughout our Financial history.
______________________________________________________________________________________________
The Weightings For Skew:
United States 69.03%
Japan 6.24%
United Kingdom 4.05%
Canada 3.26%
France 3.25%
Other 14.18%

Consumer Discretionary Ponzied - Made in China - Stuck at Sea Spendy Spendy. What's your vice? Ahhh the ecommerce addicts buying IP infringed products from overseas. oh well. Hooray *rising rates environment!
Go small cap gems!!! "Buy American Act". Thanks Biden.
Go USA!!


MSCI inc. - Daily / WeeklyDaily Chart und Weekly Chart in special situation.
Maybe Double Top or higher
At least: Correction starting within next weeks.
Means not only US Stock Market with strong correction.
Red will be the colour round the world in january/mabye February also.
No special Comment to chart, it's figured out
Chart
Price
Slow stochastic
OBV (!) unique!!!
RSI
regards, Dan

MSCI LevelsNot sure what to say about this one other than that it looks as parabolic as everything else.

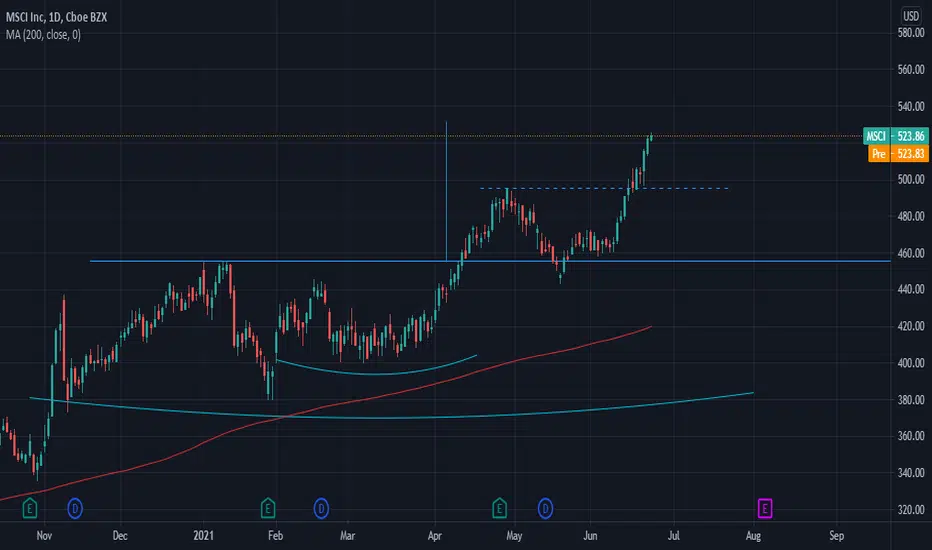
MSCI PREDICTIONHey guys, MSCI is in a bullish push, large volume sold great potential to breakout the stabilization zone and to climb above.
Please LIKE & FOLLOW, thank you!

MSCI bulls are fighting back - maybe the beginning of ...Very strong bullish engulfing
The lower band was penetrated
Rising and higher than average volume
weekly and monthly analysis don't object
Warning: middle band can show resistance, yet the candle looks very strong
