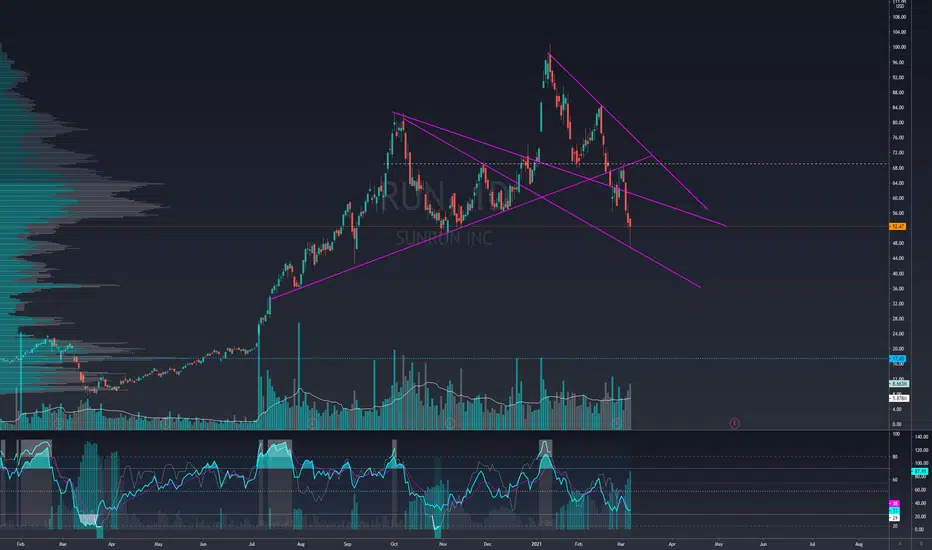
Break out coming, swing tradingEnd of the descending wedge, bullish pattern, 43 support Hold well.
Bullish wolf wave on daily, targeting 60$
3S9 trade ideas

$RUN - Potential diving board breakout. Target $63Potential diving board breakout.
Target - $63
———————————————————
How to read my charts?
- Matching color trend lines shows the pattern. Sometimes a chart can have multiple patterns. Each pattern will have matching color trend lines.
- The yellow horizontal lines shows support and resistance areas.
- Fib lines also shows support and resistance areas.
- The dotted white lines shows price projection for breakout or breakdown target.
Disclaimer: Do your own DD. Not an investment advice.

RUN - Potential renewable energy sector reversal LONGRegardless unstable market situation, last couple days renewable energy showing signs of potential growth.
Remember these stocks are still in down trend. Keep your risks low.

RUNInteresting setup going into earnings tomorrow. Chart looks SUPER weak imo. Could start a nasty head & shoulders back down to sub $10s. Would love a gap up tomorrow for an earnings play.

RUN - Bearish continuation in downtrendRUN is in a down trend from ATH. The current set up is a descending triangle that looks to be coiling lower. Resistance has been confirmed three times and a retest of the upper limit is likely. However, it seems more plausible to see a bearish break of the horizontal resistance as the descending triangle is a bearish continuation pattern in the majority of cases. As well, there is hidden bearish divergence on the daily chart.
Fundamentally: earnings could prove to be a catalyst on the heals of the Biden Green Initiatives. However, in reading customer reviews the companies ratings leave much to be desired.
From a technical and fundamental standpoint I am short RUN.


buy sunburnjust tested $50 psychology level (price) and strong major area. Also every time it hit that area in the past it buys and it broke out of the daily channel of the downtrend it broke out of daily downtrend & 4 hr downtrend once it broke out it retested the area of the breakout and is going back up also you have the moving average cross over with the blue over red on daily timeframe. also they just partnered with Vivnt ( I used to work for them) amazing company for solar and is evironmental friendly

Negative Divergence at ResistanceRUN is at resistance with hourly negative divergence. Look for an impulsive break above 57.. if it doesn't then I think we are heading back down to 45ish.


Sunrun making a RunAs Earnings is coming up for Sunrun, in the next 30-35 days it should break out and we should be able to see good long term returns with this Solar Company.


Positive DivergenceRUN is in a downtrend but that could be coming to an end as it has just put in positive divergence on the daily.

$RUN 4/6/2021From a TA perspective $RUN looks like it is about to break out of this wedge. It has tested this $59.60 3x already and failed to hold over it.
After many attempts it is bound to break it I'd look for $67.44 and $73.77 to be my next targets.
$51.57 Stop Loss cut anything under it

RUN🌦➡️Pattern recognized:
Irregular flat
➡️Hypothesis:
Bullish
➡️Inter-market analysis:
➡️Conclusion:
LDC fractal on 5 min chart. Buy calls
***This does not constitute financial advice.***
If you like what you see why not support us?
👇

RUN 🌦Good afternoon astronauts. I'm expecting a blast off as we get closer to earnings a fractal seems to be forming on the 5 min chart. According to Trading View the Beta of RUN in the last year is estimated at over 2. This means that when the market moves by 10% this stock is expected to move by 20%. I'm very bullish on the market SPX500, US30 and NAS100. Here's to new highs.


RUNWould have loved to get in under $47 but target never hit. Breakout looks solid. Would like to get long on a test of the 20 sma.


BULLISH on RUNI’m using MACD 15,30.
When RUN has managed to be this low -2.85 MACD it has been able to make some significant gains.
It has dropped as low as -5.06 what makes this a great opportunity i believe.
RED ARROWS-
March 23rd-April 29th
~ $8.25 - $15.25
~55% gain
ORANGE ARROWS-
Nov. 2nd - Nov. 27th
~ $50.00 - $70.00
~40% gain
GREEN ARROWS
Feb. 4th - Feb. 12th
~$70.00 - $83.00
20%
BLUE ARROWS
March 10th 2021
N/A

ABC BullishPossible stop a few ticks below C or last pivot low..
This is an ABC correction move and is a measured move down within a larger measured move up. D is the target. C must be above A. These patterns appear over and over within the markets.
The target is based on the length of the AB leg using fib levels.
This one is a ways over long entry level...I like to spot these a bit closer to C but sometimes I just do not see it in time. There are 4 dojis in the last 7 daily candles which can represent indecision.
NV and OBV are high. Short interest has decreased significantly since the last time I looked at this which was a few months ago..
Not a recommendation..


RUN weekly 50 SMA touchLove this RUN chart. Needs to regain the Daily 200 but big hold on the weekly 50 SMA . May long commons as a core and trade options as I see fit