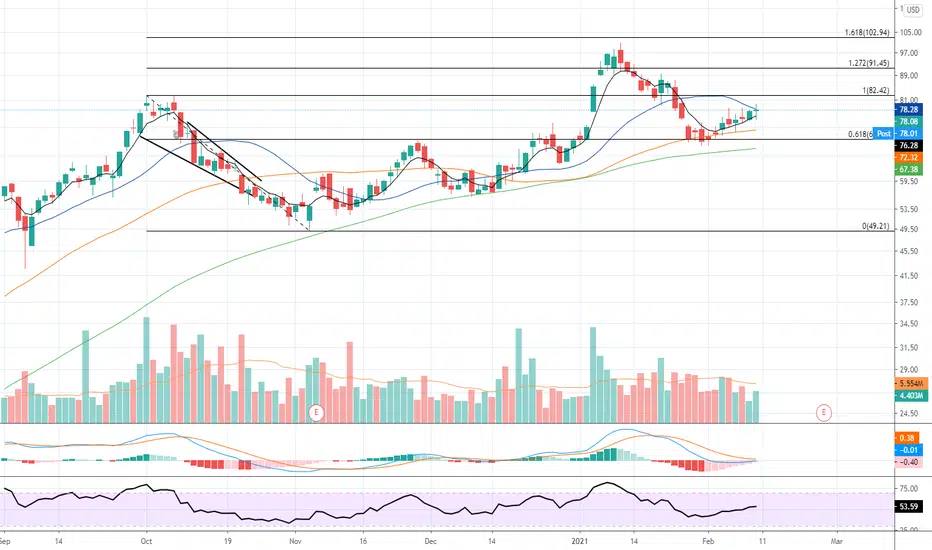
RUN Inverted H&S and Fibonacci Forming;Good Earnings.
MACD Bullish, Full stochastics Bullish.
Inverted Head and Shoulders and Fibonacci 68.3% resistance at 71.27$ and MA 50 resistance at 74.53$. If both are broken. The risk to Reward is 5X.
Stay Patient.
3S9 trade ideas

$RUN 2/28/21$RUN
AFTER DUCKING MY TARGETS FOR A FEW WEEKS AND PULLING BACK WITH THE REST OF THE MARKET EXPECT A LITTLE RUN UP AFTER THE GOOD EARNINGS.
ALSO A POTENTIAL CATALYST IS THE 3T INFRASTRUCTURE BILL THAT IS IN THE WORKS. WITH THE NEW ADMINISTRATION THERE COULD BE MORE SPECULATION INTO GREEN ENERGY.
THIS IS NOT FINANCIAL ADVICE AND IS POSTED FOR MY RECORD.

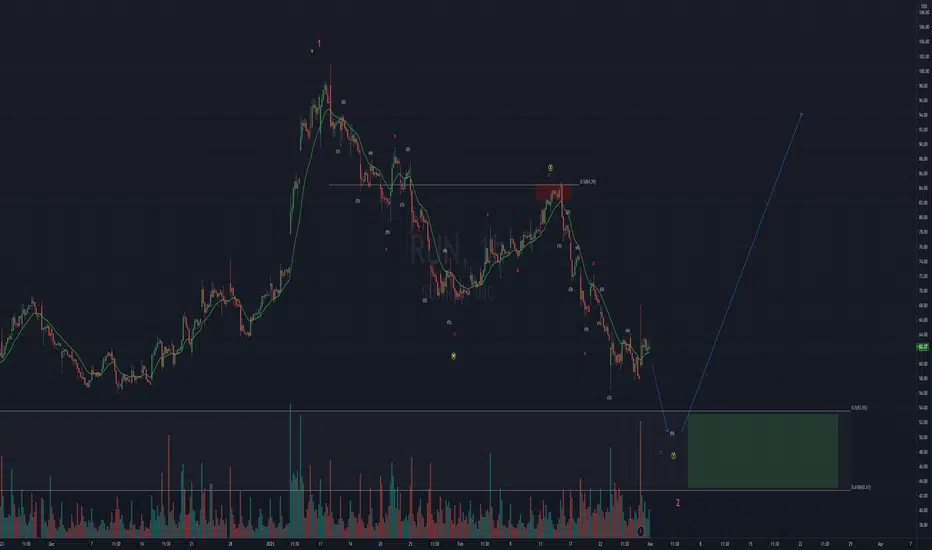
Run Wave 2 Dip BuyA Large corrective move should be close to an end to complete minute wave 2. This presents a great swing long buy opportunity.

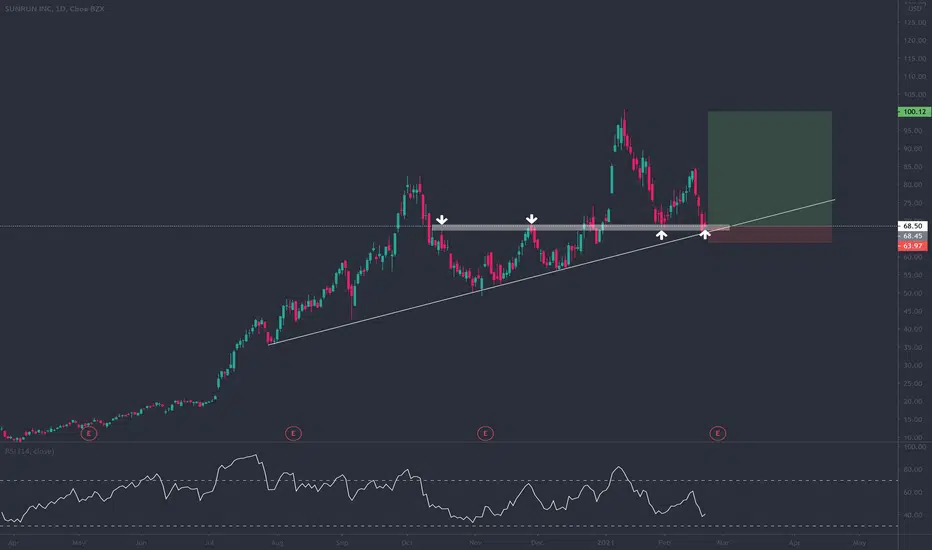
Potential H&S on Sunrun, sitting on last trend support (2/19)Large head and shoulders, broke down out of ascending wedge. There may be better solar names to go long on. Enphase being the obvious one.

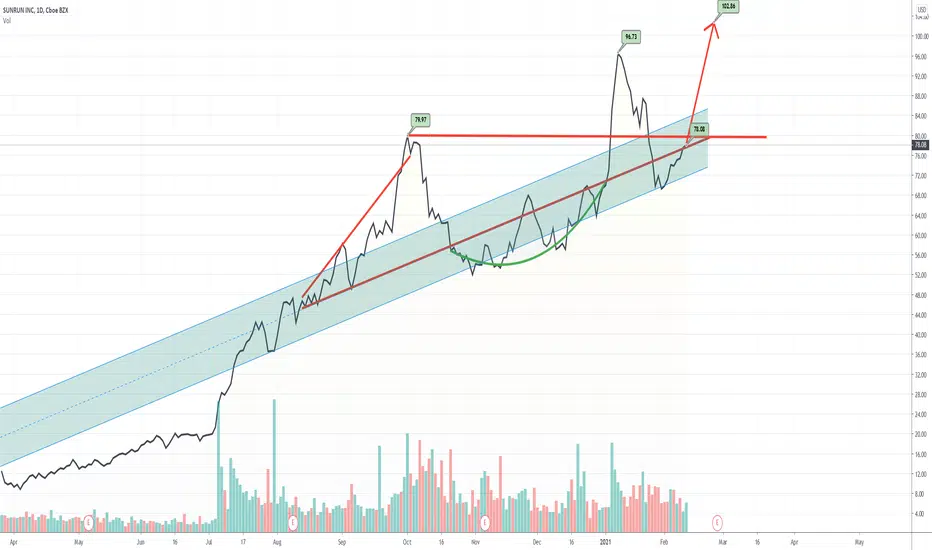
$RUN ready for a long run, huge accumulation$RUN ready for a long run, huge accumulation
TP1: 124
TP2:167

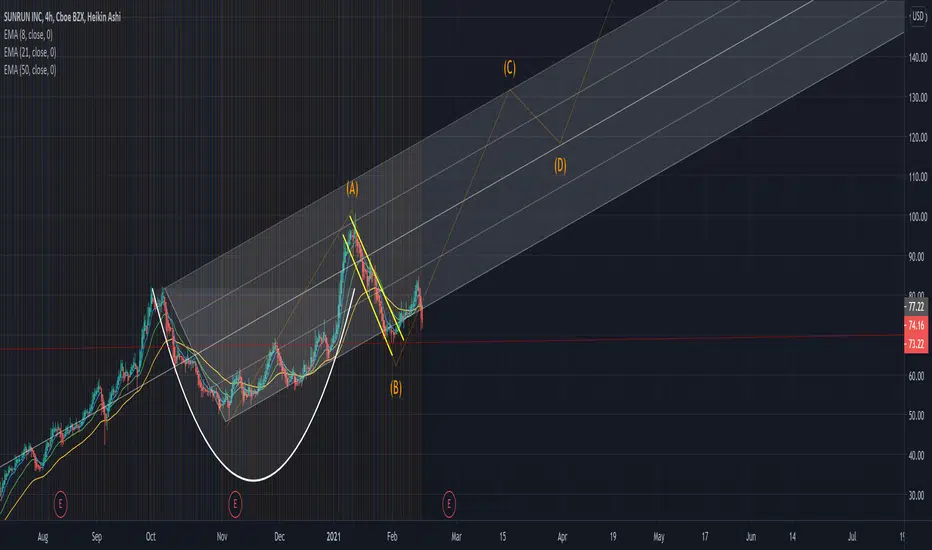
UPDATED💡$SUN ☀️ catching the next run on Sunrun?💰+46%🏌️♂️Updated technical analysis for Sunrun. Please see my previous post for the full DD.
🔎This is not financial advice. Always do your own research and due diligence. Always wait for directional confirmation before entering a trade.
NYSE:SUN

Touching $61 then to the Moon RUN looking to touchdown around $61-62 to bounce back to $84 real quick; when? Soon.

RUN, MACD Histogram just turned negativeThis is a Bearish indicator signaling RUN's price could decline from here. Traders may explore shorting the stock or put options. Tickeron's A.I. dvisor identified 44 similar cases where RUN's MACD histogram became negative, and 35 of them led to successful outcomes. Odds of Success: 80%. Current price $68.83 crossed the resistance line at $70.54 and is trading between $70.54 resistance and $67.97 resistance lines. Throughout the month of 01/14/21 - 02/17/21, the price experienced a -17% Downtrend. During the week of 02/09/21 - 02/17/21, the stock fell -4%.
Bearish Trend Analysis
The 10-day RSI Indicator for RUN moved out of overbought territory on January 14, 2021. This could be a bearish sign for the stock. Traders may want to consider selling the stock or buying put options. Tickeron's A.I.dvisor looked at 45 similar instances where the indicator moved out of overbought territory. In 34 of the 45 cases, the stock moved lower in the following days. This puts the odds of a move lower at 76%.
The Stochastic Indicator may be shifting from an upward trend to a downward trend. Tickeron A.I. detected that in 44 of 59 cases where RUN's Stochastic Oscillator exited the overbought zone, the price fell further within the following month. The odds of a continued downward trend are 75%.
Following a 3-day decline, the stock is projected to fall further. Considering past instances where RUN declined for three days, the price rose further in 50 of 62 cases within the following month. The odds of a continued downward trend are 70%.
RUN broke above its upper Bollinger Band on February 11, 2021. This could be a sign that the stock is set to drop as the stock moves back below the upper band and toward the middle band. You may want to consider selling the stock or exploring put options.

I'm still bullish on $RUNMy original thesis was a cup and handle inside a pitchfork. That may have been busted by todays market dip, but I am I also believe it could be an anomaly. Tomorrow will be very telling.
A green day puts us back in the pitchfork and on track for our handle to really lift off. A red day we will hit the .618 and I am setting that as a hard stop-loss.
$RUN at a previous support/.618 retrace with HBD on 4h and D$RUN is at a previous resistance/support. Also at the .618 retrace from the october low to the jan high. Should be a strong support. Risk management is easy since you wouldnt want to go much under this support. the HBD looks great on both time frames. Would target a previous high. Could take profits at that point and let some ride.

RUN LONGAnticipating a good earnings. A lot of interest around calls @$100 strike for feb19th.
#renewable#solar

RUN - Ascending ChannelRUN looks to be following its course in an ascending channel. Golden Cross occurred on 2/10. Possible challenge to new highs.

RUN - Possible Breakout Opportunity
RUN looks like it's finally breaking out to the upside here. Drawn with the furthermost trend lines (purple lines) on the wicks, this should be in a safe spot to expect a pullback for entry in the 75.50 - 76.50 zone before another leg up.
There are two areas that are considered the golden retracement zones (50% and 62%) for any possible rejections. These are my interest areas to capture profits. Levels to be aware of are 79.00 / 81.50 / 84.50 / 88.50 on the upside. This plan will be considered a failed break out if it closes under 74 or 73.50 to be more precise.
200-count Linear regression also helps visualize this trend as it's above the midline and continuing to point upwards. Pullback via linear regression also shows the 75.50 - 76.50 area as support.
Only downside is that the momentum of the push wasn't as great as I had expected and seems to be fizzling out. Perhaps a sector rotation back into Energy - Clean energy would help push this further.
There's also a possibility of a run-up towards the earnings at the end of month. I expect to take off most of my position by then, as their preliminary earnings release (and sell off afterwards) goes to show that investors' money can be better spent elsewhere in the meantime. At least, until it can fit the assumption that RUN is worth what it is at this price.

RUN Forest $RUN!!Bouncing off FIBO.
Buy signal with 7/confirms.
Earnings run up on 2/25.
Happy Trading, from CJ -- aka the greatest FURU.
To find out more about The Ultimate Stock Indicator on Tradingview, please check my public profile.

$RUN | Trendline BreakoutRun broke out of a trendline and looks ready for continuation to the upside.

RUN over 78.67Broke descending trendline as of Friday, bullish consolidation pattern with the basing and curling around the low 70's. Solar looks good by the looks of $TAN ETF like the sector is ready for some rotation.


beautiful trend channel for calls and puts! love it :)great dip entry for shares/long term calls in my opinion. this trendline support should hold! history always repeats itself, so why wont it happen this time? exactly. long 75, stop loss 67 and target 100-110+ by April. amazing risk reward here, and the chart can go higher if top trendline resistance breaks. goodluck :) leave a like !

